Introduction
Why is it so hard to get manufacturers’ performance datasheets? And when you do get them, why are they so hard to decipher? Vaillant Arotherm performance data is no different.
This article looks to help with both of those questions and bring you the performance tables for the 5 kW, 7 kW, 10 kW and 12 kW aroTHERM Plus models in a format that’s easier to understand.
Most people never see these tables because they’re buried deep inside technical PDFs meant for installers, not homeowners. Even if you do find them, you’re faced with pages of figures that mean little without context.
Here I’ve laid them out so you can actually use them, showing what each number means, how to read the tables, and how the official data stacks up against real-world performance.

Table of Contents
Use the Table of Contents below to jump straight to the section that matters most or scroll through at your own pace.
This article is part of my wider series of Vaillant Arotherm guides, aiming to demystify the settings that matter most for efficiency and comfort.
Vaillant Arotherm Heat Pump Guide & User Manual
The Czech Republic “Gold Dust” Tables
I first made reference to these tables in my Top of the SCOPS article.
The summary of that article was a deep dive into the Vaillant performance and datasheets tables to show that the bigger units (10/12kW) had a higher performance ceiling than the smaller 5kW and 7kW units.
You can grab the official Vaillant aroTHERM Plus technical data sheet here on my site:
vaillant-specs-kl-06-e2-verze-01-01062021-2108745.pdf
The document covers the full Vaillant aroTHERM plus range, including the 3.5 kW VWL 35/6, 5 kW VWL 55/6, 7 kW VWL 75/6, 10 kW VWL 105/6 and 12 kW VWL 125/6 air source heat pumps.
Are Some Vaillant Arotherm Models Software Capped?
One observation you can make from looking at the data, it shows that in some cases the smaller models are software-capped versions of the larger ones.
-
The 3.5 kW and 5 kW perform identically up to around 85 rps on the compressor.
-
The 10 kW and 12 kW behave the same up to around 90 rps.
At low output, the pairs (3.5kW / 5kW and 10kW / 12 kW) modulate down to the same level because they’re effectively the same unit under the hood, just appear to be limited by software at the top end.
You can see this clearly in the Gold Dust tables.
How to Read the Vaillant Performance Tables and Datasheets
Each model has four pairs of tables showing performance at these flow/return temperatures:
-
35 °C flow / 30 °C return
-
45 °C flow / 40 °C return
-
55 °C flow / 47 °C return
-
65 °C flow / 57 °C return
The tables list:
-
Outside temperature
-
Compressor speed (rps)
-
COP (coefficient of performance)
-
Heat output (kW)
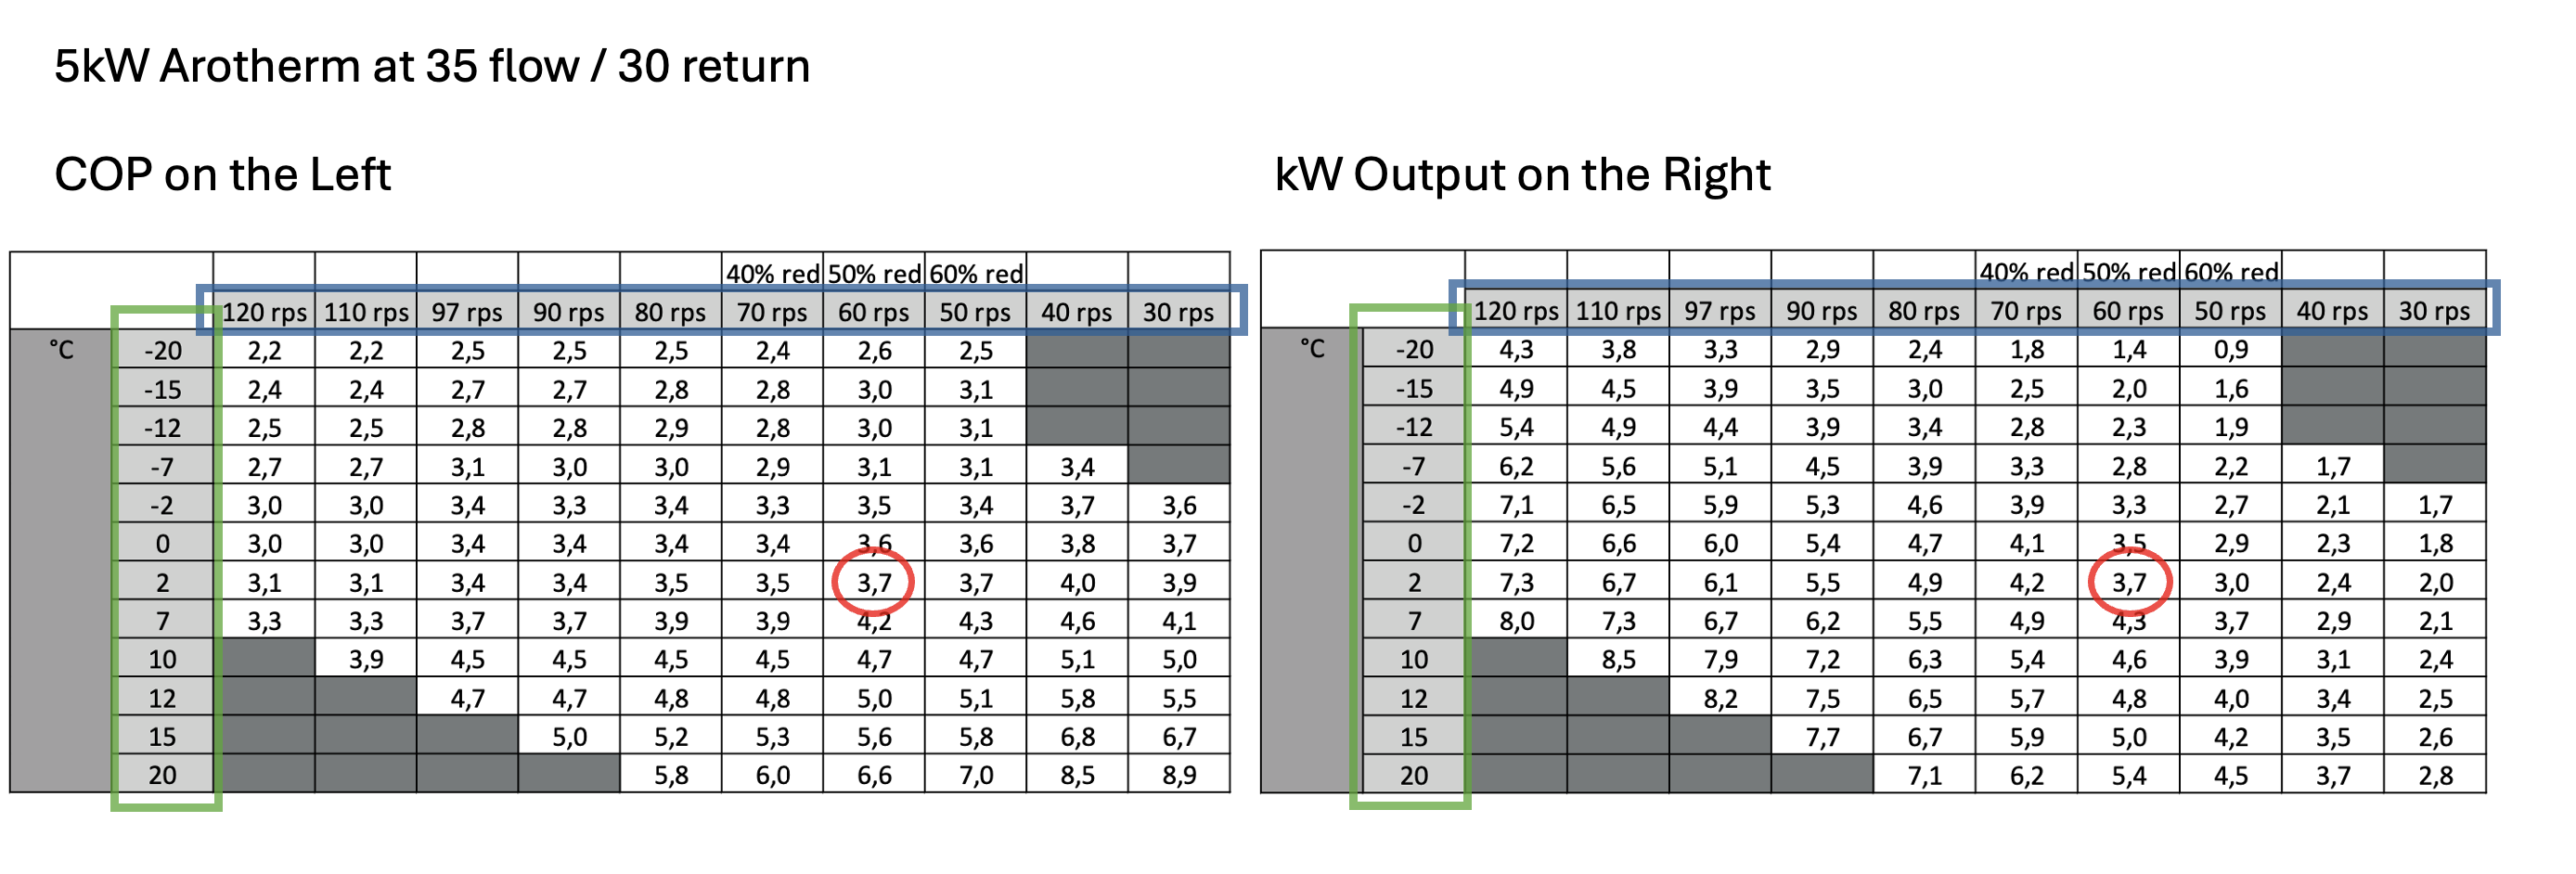
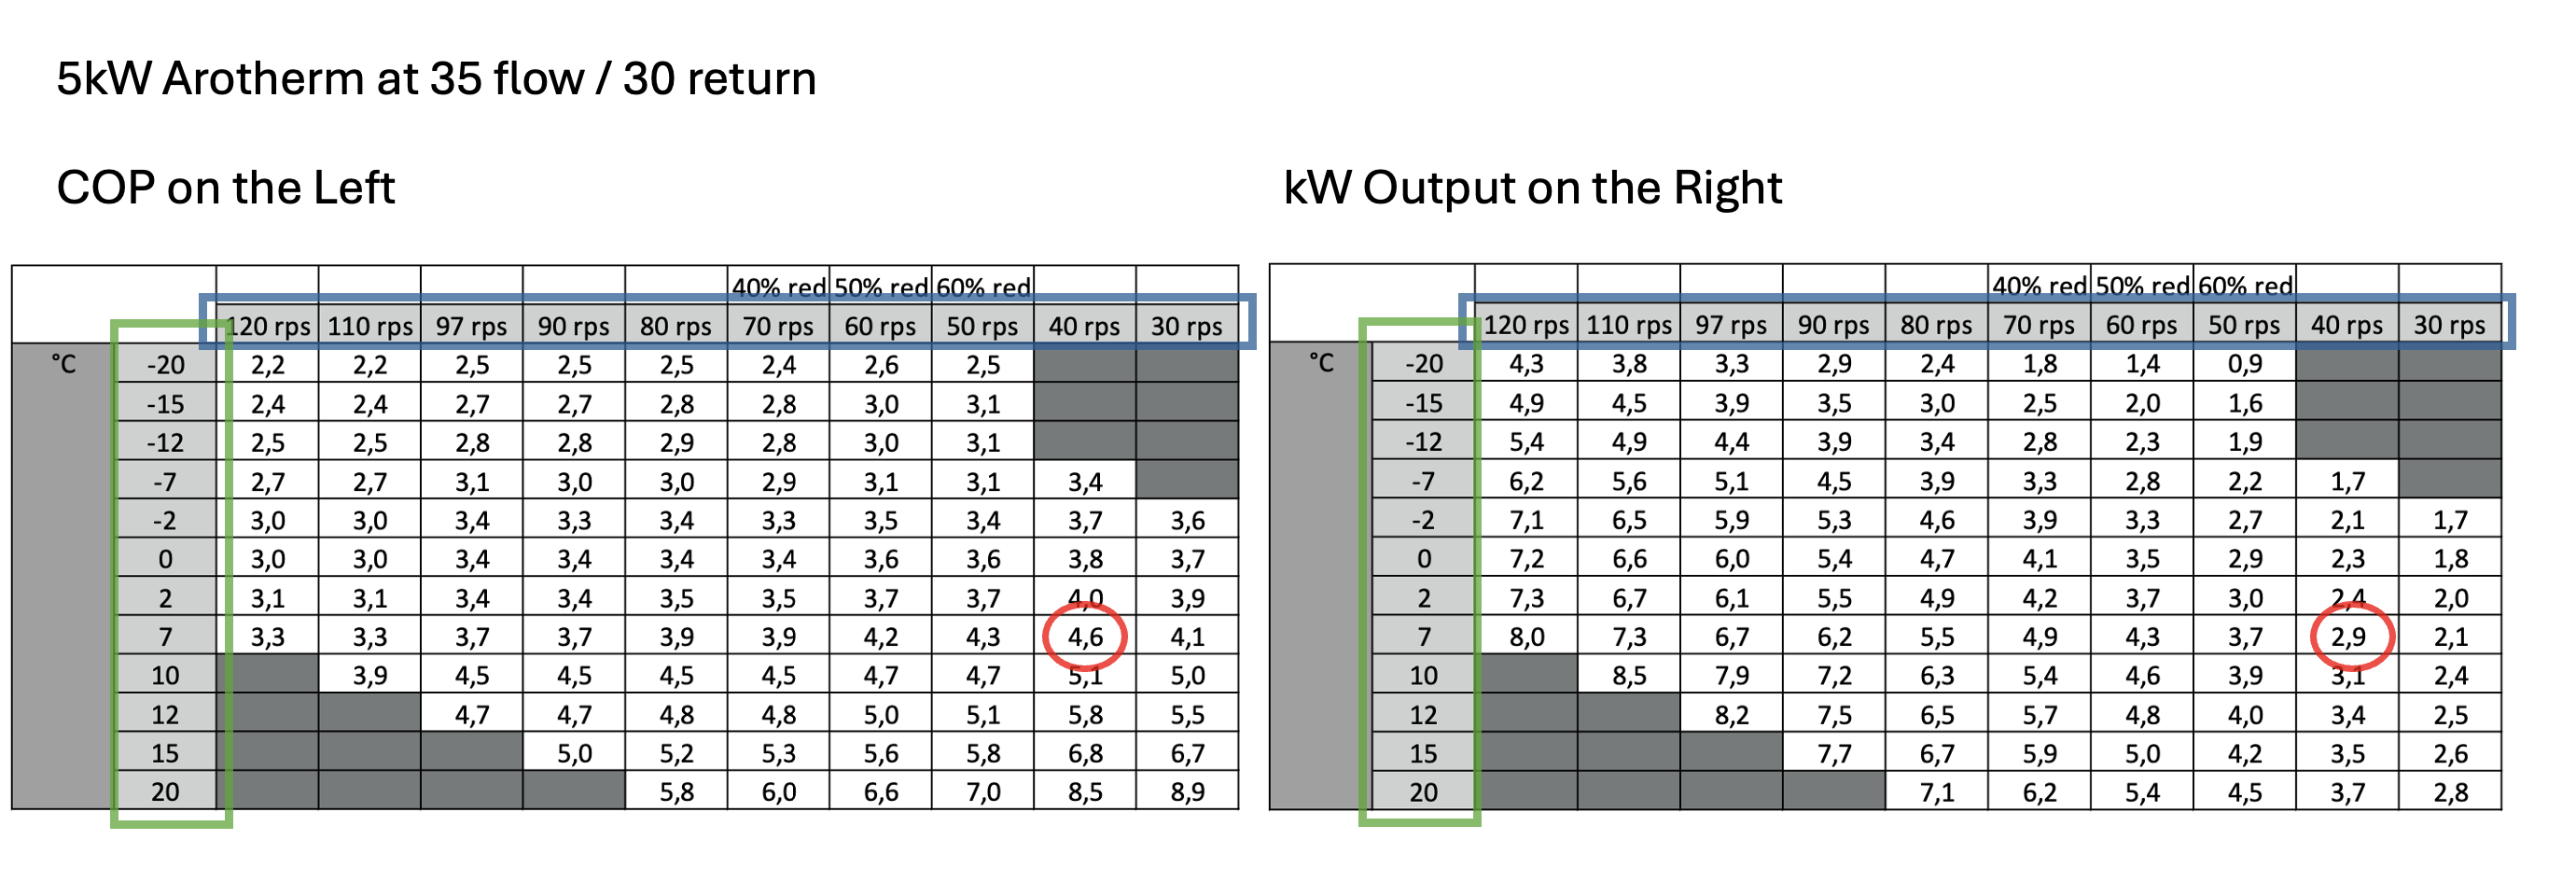
Example: 5 kW Vaillant aroTHERM at 35/30 °C
This excerpt is from page 35 of the Czech tables PDF document, which shows the tables from the 5kW Arotherm at 35C flow and 30C return.
- Green box – Outside Temperature
- Blue box – Compressor Speed rps (revolutions per second)
-
Outside temperature: 7 °C
-
Compressor speed: 40 rps
-
COP: 4.6 (left hand red circle)
-
Output: 2.9 kW (right hand red circle)
That means, under those conditions, you should get about 2.9 kW of heat for 0.63 kW of electricity from a 5kW Arotherm.
- COP Calculation: (2.9 kW heat ÷ 4.6 COP = 0.63kW electricity (630 Watts))
This calculation is an easy way to what the power consumption should be at any given time.
If you know your flow temperature, outdoor temperature and compressor speed, these tables are a great way to check if your heat pump is performing to spec whilst heating.
Note: as per the deep dive in the Top of the SCOPS article, whilst you can generally get to the target outputs during heating, it’s almost impossible to hit the datasheet COP during a hot water run.
Real-World Vaillant Arotherm Compressor Speeds and Performance
The top of the scops articles goes into way more detail, for example:
- How do I see what speed my compressor is running at?
- Czech Tables versus Real World (Heating)
- Real World Compressor Ranges (Heating)
- Why does my 5kW perform worse than the 7kW, 10kW and 12kW models?
- Real World Compressor Ranges (Hot Water)
- Czech Tables versus Real World (Hot Water)
and more….. if you want a deep dive into all things Arotherm performance, then hop over the Top of the SCOPS article

Making the Vaillant Performance Datasheets Easier to Use
The official tables are excellent, but they’re not easy to work with.
For years I’ve been pulling the numbers into Excel to create graphs like the ones in the Top of the SCOPs and Sweet Spot Hot Water Mode articles.
That process was time-consuming, so I built the Energy Stats UK Vaillant aroTHERM Performance Data Widget using ChatGPT.
I fed it the PDF, and after some trial and error it now generates an interactive table where you can choose your model, flow temperature and outside temperature to get the expected heat output and COP.
Are Defrosts Included in the Datasheets?
TL;DR – No, defrosts are not included in the Czech datasheet or the HTML widget.
EN 14511 – COP Figures
The COP values in Vaillant’s datasheets come from EN 14511 testing. This standard measures performance at fixed outdoor and water temperatures, such as A7/W35 or A–7/W55. These are steady laboratory conditions with no defrosting or cycling.
The Czech technical manual for the aroTHERM plus explains:
„Aby bylo umožněno porovnání tepelných čerpadel na základě topného faktoru, jsou teploty zdroje tepla a systému využívajícího teplo standardizovány (zjištěny podle normy EN 14511).“
Translation: “To allow comparison of heat pumps based on their heating factor, the temperatures of the heat source and the heat sink are standardised in accordance with EN 14511.”
That confirms the COP data are taken from fixed, controlled test points. In practice, the heat pump will occasionally defrost by reversing the refrigeration circuit to melt ice from the outdoor coil. Those short efficiency losses don’t appear in EN 14511 results.
EN 14825 – SCOP Values
The SCOP values come from EN 14825, which measures performance across a full heating season. This test includes defrost cycles, part-load operation, and standby energy, so it gives a more realistic measure of seasonal efficiency.
EN 14825 doesn’t use one outdoor temperature, like 7 °C, but a temperature range from about –10 °C to +16 °C. Each point is weighted by how many hours per year that temperature typically occurs in an “average” European climate, the same one used for UK MCS ratings.
In short:
-
The COP figures in the datasheets come from EN 14511 and exclude defrosts.
-
The SCOP figures come from EN 14825 and include defrosts and part-load effects.
Real-World Efficiency (MCS Certified Data)
The MCS product directory publishes certified seasonal performance data based on EN 14825 testing, adjusted for UK conditions.
For the Vaillant aroTHERM Plus 5 kW (VWL 55/6 A 230 V S2), the official record shows:
| Flow Temperature (°C) | SCOP |
|---|---|
| 35 | 4.48 |
| 40 | 4.13 |
| 45 | 3.77 |
| 50 | 3.41 |
| 55 | 3.06 |
Certification: KIWA 00016/018 HP
Status: Certified (since 6 Mar 2020)
Source: MCS Product Directory
You can see how efficiency drops as flow temperature rises. Around 4.5 at 35 °C suits low-temperature underfloor heating, while roughly 3.0 at 55 °C reflects a typical radiator system. These figures already include the effects of defrosting and seasonal operation.
Further Reading
There’s a good discussion on the Open Energy Monitor forum where switched on users compare datasheet figures with real-world data from their heat meters and monitoring setups.
It’s worth a read if you’re curious about how theory matches reality: Vaillant maximum output capacity testing
Energy Stats UK Vaillant aroTHERM Performance Data Widget
Heat Pump Performance Tables
What about flow temperatures below 35 °C?
The Czech performance tables start at 35 °C flow, but Vaillant aroTHERM units can run lower, and doing so usually lifts COP because the compressor has a smaller temperature lift to achieve.
A real-world example on heatpumpmonitor.org shows a 7 kW aroTHERM operating at ~26 °C flow with ~12 °C outside, delivering short cycles with a COP of ~6.8:
https://heatpumpmonitor.org/dashboard?id=264&mode=power&start=1762154260&end=1762157050

For comparison, the Czech tables suggest that a 7 kW at 12 °C ambient with 35 °C flow achieves about COP 6. Dropping flow from 35 °C toward the mid-20s can therefore nudge COP higher than the datasheets suggest.
Why This Data Matters
These tables aren’t just academic. They help you check that your system is running correctly.
Example:
If you have a 5 kW aroTHERM running at 35 °C flow and 60 rps compressor speed when it’s 2 °C outside, the datasheet says you should expect roughly 3.7 kW heat output with a COP of 3.7 (so 1 kW / 1000 Watts of electricity used).
If your monitoring shows that you system isn’t hitting the numbers from the datasheets then you can start troubleshooting.
Monitoring Tools
A heat-meter-based system like OpenEnergyMonitor is ideal for this.
You can track flow temperature, outdoor temperature, heat output and COP.
You can monitor my 5kW Vaillant via this OEM link: https://emoncms.org/energystatsuk, where it is also part of https://heatpumpmonitor.org
For compressor speed, check the VWZ AI White controller or use an eBus reader.
Vaillant Arotherm Minimum Output
The tables and datasheets are also a good way to check the minimum output of the heat pump.
You can then use this information to calculate expected cycle times (and at what outdoor temperature) as described in the article: Heat Pump Cycling and Minimum Modulation.
Vaillant Arotherm Maximum Output
The the data is also useful for looking at the maximum capability of the different units.
Although be aware, that because of defrosts there is some questions whether all the models can reach the maximums the datasheets say in colder weather.
The 7kW model being the one that is most questioned, as explained at the start of the Top of the SCOPs article (Vaillant defrost-gate).
And remember as explainer earlier, the figures from the datasheet do not include defrosts. So expect a reduction from the figures provided when defrosts are required.
Final Thoughts
The capabilities of the Vaillant aroTHERM Plus range is well-documented once you know where to look.
The Czech tables give you everything you need to check real-world performance, compare models, and understand what your system should be doing.
Hopefully the new widget makes the data accessible to more people and allow them to check their own heat pump against expected performance from the datasheets.
Referral information and free credit offer
If you find Energy Stats UK useful, there are a couple of easy ways to support the site and help cover hosting and server costs.
Thinking about switching energy suppliers?
Homeowners who join Octopus Energy using my referral link get £50 free credit after signing up. Business users get £100 free credit, and if you’re looking at solar or a heat pump, there’s also a £100 gift card through Octopus Tech.
Or, if you just want to say thanks, you can buy me a coffee.
You can also see more ways to support the site here via the likes of Plusnet broadband, Smarty Mobile, Havenwise remote heat pump control, Hetzner Cloud hosting and more.
Follow @energystatsuk on Twitter / X, Bluesky and Mastodon for daily tariff graphs and updates.
Note: The current and past performance of energy pricing is not necessarily a guide to the future.


One Comment