Agile Price Plunges
One of the headline grabbing features of Octopus Energy Agile tariff is when prices go negative and end users get paid to use energy.
This occurs when there is too much generated energy on the grid, which usually coincides with high levels of renewable energy on the grid, so windy days/nights and/or lots of sun producing Solar energy.
When this happens, rather than turn equipment off its easier for the National Grid just to dump the energy cheaply onto the grid and pass on the savings to the end user.
National Grid have an article on the subject here: The weekend of free electricity?
And Octopus Energy produced a blog about the daytime plunge in April 2020.
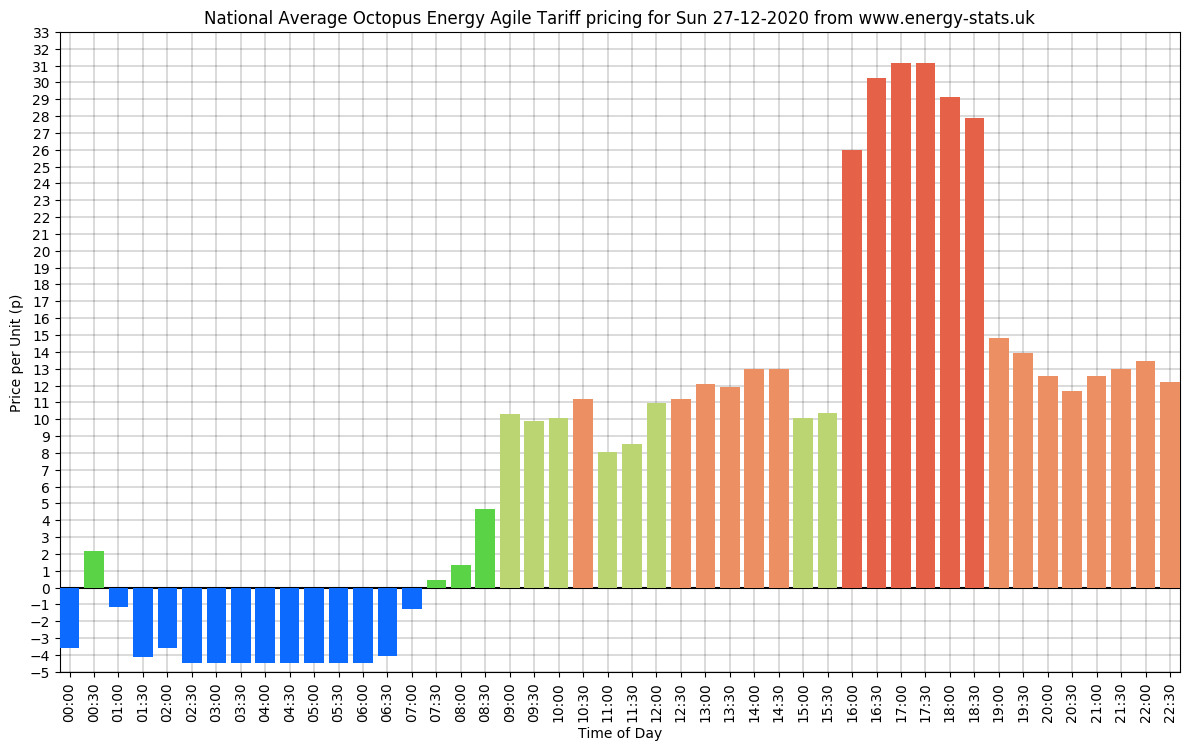
See below for an example of when pricing went negative one afternoon in December 2020.
Graph from the @energystatsuk Twitter account.

How many times has Agile gone negative?
Th number one recurring question is “How many times has Agile gone negative?”
So to answer, I have pulled all the negative price slots from Agile, going back to February 2018 and charted it below.
The answer….. IS A LOT!
Note: this pricing data is the from Yorkshire region, but the pricing varies so little region to region, its not worth creating 14 different tables of negative pricing.
Negative Pricing 30 minutes slots on Agile since February 2018
Referral information and free credit offer
If you find the content of this website useful and are thinking of joining Octopus Energy, please consider using my referral code or ‘buy me a coffee’ to help support running costs of the website.
Using this referral code will gift you £50 of free Octopus Energy credit after signup: https://share.octopus.energy/linen-pearl-869
If you would like to ‘buy me a coffee’ to show support, please use this link: http://buymeacoffee.com/SVHgIbUYM
If you’re considering owning part of a wind farm through Ripple Energy, get £25 of free credit (if investing more than £1000) using my Ripple referral link.
Energy Stats can also be found on Twitter / X. Please follow us @energystatsuk for daily Agile tariff pricing graphs and summaries.
We have also started posting the same graphs over on Mastodon. You can find us here: https://mastodonapp.uk/@energystatsuk
And we are even trying to get the info out via Instagram. Find us here: https://www.instagram.com/energystatsuk/
Note: The current and past performance of energy pricing is not necessarily a guide to the future.


