I’m Mick Wall, and I started this site back in 2019 as a hobby project to make Octopus Energy smart-tariff data easier to understand.
Using Octopus Energy’s open APIs, the site collects and summarises both historical and daily pricing data for popular tariffs including Agile, Go, Intelligent Go, Cosy, Flux and Tracker—as well as export tariffs where you get paid for surplus solar, wind or hydro generation.
Just use the menus to find the region and tariff you want to explore.
Here on Energy Stats UK you’ll also find data and blogs covering the key themes in today’s energy world: smart tariffs, wholesale energy prices, heat pumps, solar power, home batteries, and EV charging.
Alongside the live data, I share my own renewables journey—from solar PV and home batteries to heat pumps, EV charging, and more. My writing has even led to features on BBC News, the Heatio Home Energy Show, BetaTalk, Gary Does Solar and other podcasts.

If you would like to support the website you will find an Octopus referral code for £50 of free credit on this page, along with other ways of helping.
Note: This Energy Stats website has no affiliation to Octopus Energy other than me being a regular and happy customer.
If you wish to contact Octopus Energy themselves, you can find them here: https://octopus.energy/contact-us/
Octopus Energy Tariff Pricing
The UK electricity market is split into 14 separate distinct regions, such as Yorkshire, London, Northern Scotland etc.
You can read more about the different regions in this article: https://energy-stats.uk/dno-region-codes-explained/
As the price of electricity differs for each region you will find 14 different pages for each of the various Octopus smart tariffs. This ensures you see the real world price from your region.
Here is a list of the various tariff pricing we currently have on the website
- Octopus Agile Tariff
- Octopus Go Tariff
- Octopus Intelligent Go Tariff
- Octopus Cosy Tariff
- Octopus Tracker Tariff
- Octopus Flux Tariff
- Octopus Intelligent Flux Tariff
- Octopus Shifters Business Tariff
- Octopus Outgoing / Export Tariffs
Just click on one of the above links to start exploring the pricing graphs and tariff information.
Or use the Octopus Energy Smart Tariff summary article to learn more about each tariff.
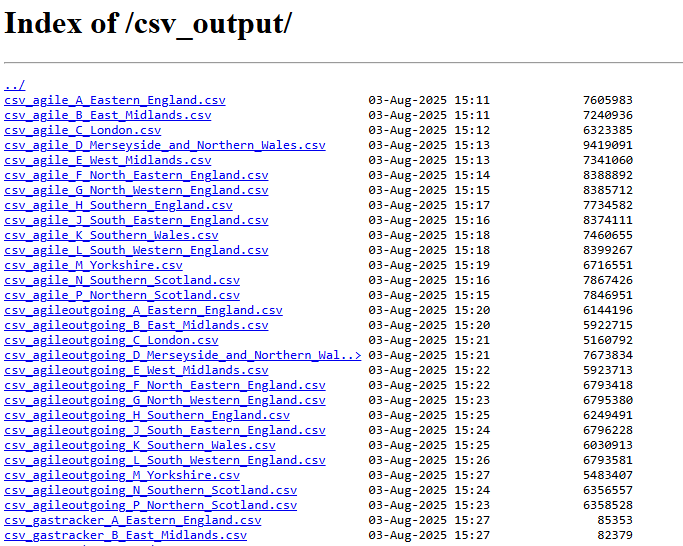
Download Historical Tariff Data
The majority of the website is comprised of pre-canned graphs.
But you can also download raw historical pricing data for a variety of tariffs.
This data goes back to 2018 for all 14 regional areas in CSV format via our Energy Stats Download Data page.
Daily Pricing Graphs via Twitter / X, Mastodon and Bluesky
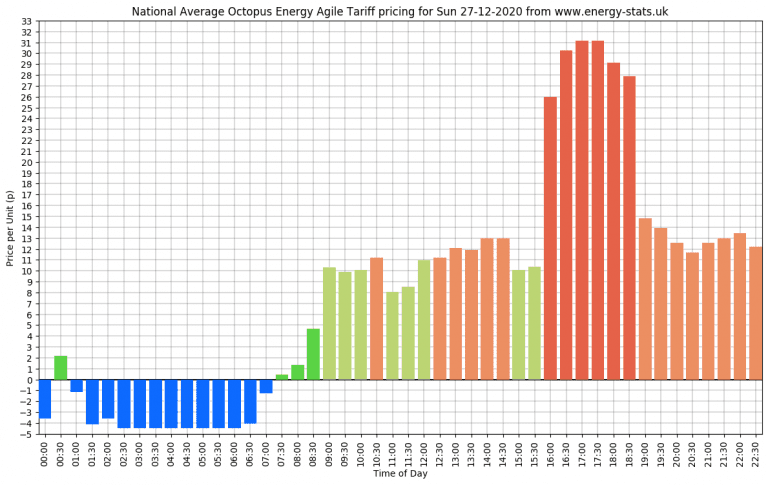
Octopus Energy release the pricing data from the Agile tariffs (import and export) at around 4pm each day in readiness for the following day. We also post Tracker and Greener Days information each day too.
The Twitter account @energystatsuk summarises the data graphs and publishes the data each day.
And we have also started posting the same graphs over to both Bluesky and on Mastodon.
We now have the website setup with it’s own page on LinkedIn too.
If you are interested in how the graph colours are decided, please visit the dedicated Daily Graph Colour page.

Energy Stats User Configurable Dashboards
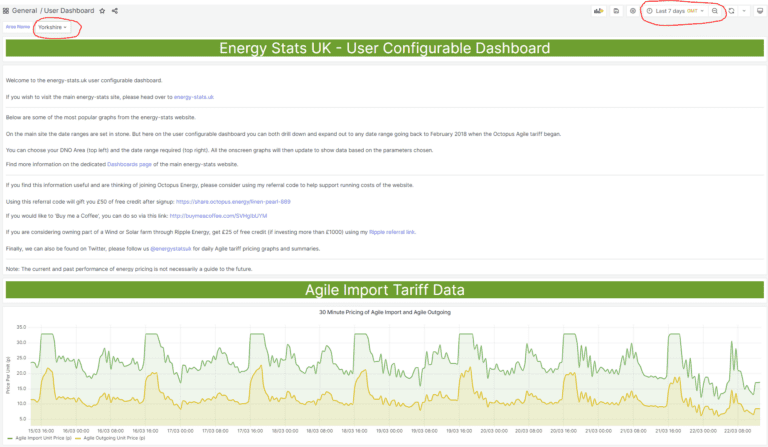
Gain more granular access to the underlying data via user configurable graphs.
Find out more over on the Dashboards page.
You can choose from each of the 14 regional DNO areas as well along with any timescale you wish.
There are a whole host of different graphs covering the majority of Octopus Energy smart tariffs.
Vaillant Arotherm Heat Pump Guide
Having owned our Vaillant Arotherm 5kw Heat Pump since 2022 means I’ve been able to collect a lot of knowledge about the unit and how it performs.
The blog section of the website is full of various Arotherm related material, but the information is spread across many articles.
So this has been all pulled together into one single article called: Vaillant Arotherm Heat Pump Guide: Weather Curve, Hot Water Modes, SensoCOMFORT, COP & SCOP.
If you own a Vaillant Arotherm Plus heat pump—or are considering one—this article will help you get the most out of setting up, monitoring, and fine-tuning.
Recent Blog Articles
Referral information and free credit offer
If you find the content of this website useful and are thinking of joining Octopus Energy, please consider using my referral code or ‘buy me a coffee’ to help support running costs of the website (hosting fees / cloud servers etc).
If you’re thinking of switching energy suppliers, homeowners that use this referral code can claim £50 of free Octopus Energy credit after sign-up: https://mickwall.octopus.energy
Business users that switch and sign-up using the same code with be granted £100 of free credit.
Get a £100 gift card when signing up for Solar or a Heat Pump installation through Octopus Energy using this link: https://tech.referrals.octopus.energy/ucMTeP8d
If you would like to ‘buy me a coffee’ to show support, please use this link: http://buymeacoffee.com/SVHgIbUYM
Energy Stats UK can be found on various social media platforms posting daily tariff pricing graphs and summaries.
Be sure to follow @energystatsuk on Twitter / X, Bluesky, Mastodon and Instagram.
Note: The current and past performance of energy pricing is not necessarily a guide to the future.


