UK wholesale energy pricing changes every day and sets the baseline for electricity bills. Most suppliers don’t buy all their power on the spot; they secure much of it in advance through futures contracts, a process known as hedging. That helps keep supply predictable and limits volatility, but when wholesale costs rise, households and businesses still feel it. If you want a deeper dive into how hedging works, see this guide from Simply Switch.
Alongside those long-term contracts, the UK also runs a day-ahead electricity market where suppliers bid in half-hourly auctions. Prices here can move sharply, especially when gas sets the marginal cost or when renewables flood the grid. These wholesale prices feed directly into tariffs such as Octopus Agile, making them visible to consumers in real time.
On this page you’ll find live graphs, historical trends, and the uk day-ahead electricity price today. You can also download wholesale pricing CSV files to run your own analysis.
Article updated: February 2026

What You’ll Learn On This Page
-
How UK wholesale energy pricing works in futures and day-ahead markets
-
Why hedging affects electricity bills for homes and businesses
-
How the Octopus Agile tariff reflects wholesale costs in real time
-
Daily updated graphs of wholesale electricity prices
-
Where to download historical wholesale pricing CSV data
Table of Contents
UK Day-Ahead Wholesale Electricity Pricing Explained
The UK day-ahead market is one of the main drivers of wholesale electricity pricing.
While most electricity is bought months in advance through hedging, suppliers sometimes need extra power closer to real time.
This is where the day-ahead market comes in. Suppliers bid in half-hourly auctions to buy electricity for delivery the next day. Prices are set using marginal pricing, which means the most expensive generator needed to meet demand, often a gas plant, sets the final wholesale price for everyone. Even when cheaper renewables like wind or solar are available, gas can still drive the cost.
Occasionally there’s so much supply on the system that the market tips into negative pricing, where generators effectively pay to offload power. These spikes and dips show how dynamic the wholesale market can be and why tariffs linked to it, such as Agile, change every 30 minutes.
I’ve always been interested in the relationship between the Octopus Agile tariff, the underlying wholesale cost, and day-ahead auction pricing.
To understand it better, I contacted a few day-ahead auction data providers to see how much detailed wholesale pricing access would cost. Bearing in mind that Energy Stats UK is just a geeky hobby site, the subscription fees were way out of reach.
You can see single-day UK auction prices here: Nord Pool UK day-ahead prices.
Access to historical or broader datasets requires a subscription. For example, the Nord Pool Data Portal charges €1,200 per year for up to three users on the BASIC plan.
This challenge led me to explore how to reverse engineer indicative wholesale electricity prices from the Agile data that’s publicly available.
Here’s a graph showing the indicative daily average UK wholesale electricity price over the past two years:
Indicative Daily Average UK Wholesale Electricity Pricing (last 2 years)
How the Octopus Agile Tariff Reflects Day-Ahead Pricing
The Octopus Agile tariff is a real-world example of a time-of-use tariff that passes through wholesale costs almost directly. Every 30 minutes, the price you pay is linked to the day-ahead wholesale market, with a small adjustment for distribution charges and balancing costs.
This setup means household bills track market movements in near real time. When wholesale prices fall, such as during windy nights or sunny afternoons with strong renewable output, Agile users often benefit. But if prices spike because gas sets the marginal cost, customers see that reflected too.
For anyone interested in tracking Agile pricing, we publish current and historical data on our dedicated page: Octopus Agile Tariff Pricing.
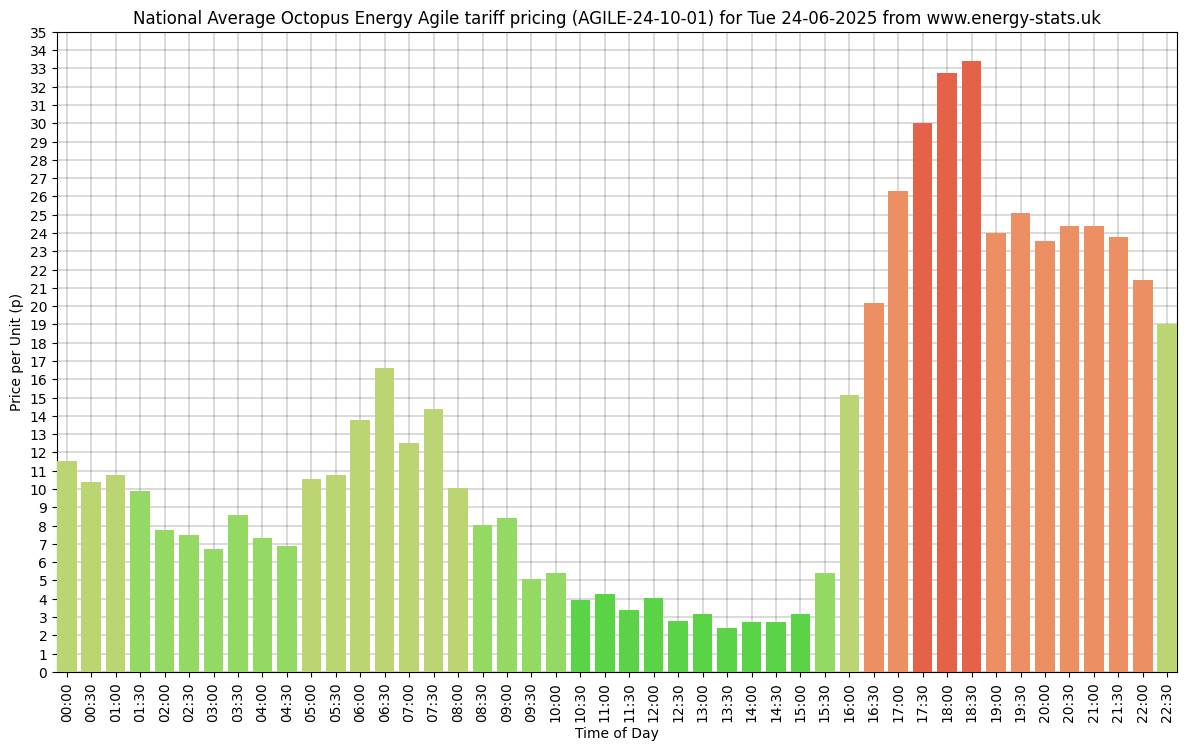
The graph below from Tuesday 24 June 2025 shows how half-hour prices can move throughout a single day.
Graphs like these, from Agile and other tariffs, are shared daily on Energy Stats UK’s social channels (Twitter/X, Bluesky, Mastodon), so it’s worth following to stay up to date
How the Agile Tariff is Calculated from Wholesale Pricing
Agile is based on the wholesale day-ahead auction price, multiplied by a factor, with peak surcharges and VAT added.
The formula has been public since Agile launched in 2018, and in practice it works like this:
-
Start with the wholesale auction price (for example £123/MWh = 12.3p/kWh).
-
Apply the Agile multiplier (×2.2).
-
Add the peak-time charge between 4pm and 7pm.
-
Include 5% VAT.
So a £123/MWh slot at 10am becomes roughly 28.4p/kWh, while at 5pm it rises to about 40.4p/kWh.
Analysts often compare these costs with benchmarks such as spark spreads, which show the profitability of gas plants, to understand how wholesale conditions flow through to tariffs. For households, the key takeaway is that Agile makes those wholesale dynamics visible on your bill.
Note that wholesale pricing data from Nord Pool (or Epex) is often in UTC, so during daylight saving time it may be one hour out from UK local time (BST).
Guy Lipman has detailed information on the Agile formulas and how they differ slightly across the 14 DNO regions: Guy Lipman Agile Formulas
Recreating Wholesale Prices from Octopus Agile Data
To estimate the wholesale cost, I ran the Agile calculation in reverse.
Because both Octopus Agile and Octopus Outgoing Agile prices are needed to account for caps and offsets, I could only go back to May 2019, when Outgoing Agile launched.
Using that data, I replayed my script across the full historical dataset to calculate indicative wholesale electricity prices for every 30-minute slot.
The result is a set of daily and half-hourly values that line up closely with real day-ahead market prices, giving a good picture of how the wholesale market has moved over time.
The graph below shows the last seven days of indicative wholesale prices alongside Agile Import and Agile Outgoing tariffs.
Indicative Wholesale Electric, Agile Import and Agile Outgoing (last 7 days)
Indicative Average Wholesale Electricity Pricing for each 30 minute time slot (last 30 days)
This chart shows the average wholesale electricity price for each half-hour slot across the past 30 days. It highlights when prices typically peak and when they drop, helping to show how time-of-use tariffs such as Agile reflect real wholesale movements.
Periods with high renewable output, such as overnight or midday during sunny and windy conditions, tend to show lower prices. Evenings, when demand rises and gas generation often sets the marginal cost, remain the most expensive times.
Indicative Wholesale Electric Daily Average and Gas / Electric Tracker (last 2 years)
This chart compares the indicative UK wholesale electricity daily average with the Octopus Tracker gas and electricity tariffs over the past two years. It doesn’t include wholesale gas auction data, but the gas Tracker tariff closely follows daily wholesale benchmarks, giving a good sense of how the two fuels move together.
For anyone comparing energy types, the data shows a clear link between wholesale electricity prices, gas market trends, and how both flow through to consumer tariffs. Periods of high gas costs usually push electricity prices up too, since gas often sets the marginal price in the day-ahead market.
Wholesale Energy Price Graphs & Downloadable Data
Energy Stats UK publishes daily updated graphs of indicative wholesale electricity prices, along with free CSV downloads for anyone who wants to run their own analysis.
The formulas are applied to all pricing data going back to the start of Agile Outgoing in May 2019. A daily script keeps everything current using Octopus’ published data, so the graphs and CSV files refresh automatically each day.
On this page you’ll find fixed timeframe graphs for quick reference. If you want more flexibility, the interactive dashboard lets you explore different time periods and compare tariffs side by side.
For deeper analysis, you can download the indicative wholesale electricity data in CSV format from the Download Historical Pricing Data page. These files update daily, making it easy to track long-term trends or build your own charts.
Please give credit and link back to Energy Stats UK if you use the data publicly. Thank you.
Disclaimer
These figures are provided on a best-effort basis and should be treated as indicative wholesale pricing rather than exact market data.
The values are reverse-engineered from day-ahead market prices and Octopus Agile tariff formulas. They give a realistic picture of historical wholesale electricity costs, but they are not official datasets.
Other Smart Tariffs
These smart tariffs all link back to wholesale energy pricing in different ways, either through daily variable rates or time-of-use structures.
Explore more time-of-use tariffs in our Time-of-Use Tariffs hub. Quick overview:
-
Agile – half-hour day-ahead pricing that tracks wholesale costs.
-
Cosy — time-bands for cheaper heating periods.
-
Go – overnight EV charging at low rates.
-
Flux – export-friendly for home solar/battery users.
-
Intelligent Go – smart-scheduled EV charging at cheap times.
-
Tracker – daily variable unit rate linked to wholesale benchmarks.
- EDF FreePhase – similar to Agile, but only 3 price rates per day.
Tip: these tariffs reward shifting usage to off-peak times, good for bills and for a more renewables-friendly grid.
Looking for a full breakdown of these tariffs? Check out our Time-of-Use Tariffs hub, where we compare Agile, Cosy, Go, Flux, Intelligent Go, and Tracker side by side and explain how each one works.
If you switch to Octopus Energy using my referral link, you can claim £50 FREE credit. Thank you if you do!
Wholesale Energy Pricing FAQ
Got questions about UK wholesale electricity prices and how they link to time-of-use tariffs like Octopus Agile? Here are a few quick answers that explain the main terms and ideas in plain English.
What is wholesale energy pricing?
Wholesale energy pricing is the rate suppliers pay for electricity before network charges, policy costs, and VAT are added. It sets the baseline for all customer tariffs.
How does hedging affect electricity prices?
Hedging lets suppliers lock in energy costs in advance using futures contracts. It reduces exposure to sudden price spikes and keeps supply more stable for households and businesses.
What is the UK day-ahead market?
The UK day-ahead market is a daily auction where electricity is bought and sold in half-hour slots for delivery the next day. Prices move with supply and demand, often changing every 30 minutes.
What is marginal pricing?
Marginal pricing means the most expensive generator needed to meet demand sets the wholesale price for everyone. In the UK, gas plants often play this role.
What are spark spreads?
Spark spreads measure the profitability of gas-fired power stations. Analysts use them to compare wholesale electricity prices with fuel costs.
What is the Octopus Agile tariff?
Octopus Agile is a time-of-use tariff where prices change every half hour based on wholesale day-ahead costs. It passes market movements directly through to your bill.
How is Agile calculated?
Agile takes the wholesale auction price, applies a multiplier (around ×2.2), adds a peak-time surcharge between 4pm and 7pm, and includes 5% VAT. Prices are published in UTC, so during summer they may appear one hour out from local time.
Can I track Agile prices in real time?
Yes. Half-hour Agile prices are published daily and available historically. Energy Stats UK also shares live graphs and updates on social media.
Where can I access UK day-ahead wholesale prices?
You can view daily auction prices for free on Nord Pool. Access to longer datasets or historical archives requires a paid subscription.
Where can I download raw wholesale pricing data?
Indicative wholesale electricity data in CSV format is available on the Download Historical Pricing Data page. The files update daily for ongoing analysis.
What is demand response?
Demand response means shifting electricity use to off-peak times. It helps balance the grid and can lower bills, which is the main goal of smart tariffs like Agile.
Referral information and free credit offer
If you find Energy Stats UK useful, there are a couple of easy ways to support the site and help cover hosting and server costs.
Thinking about switching energy suppliers?
Homeowners who join Octopus Energy using my referral link get £50 free credit after signing up. Business users get £100 free credit, and if you’re looking at solar or a heat pump, there’s also a £100 gift card through Octopus Tech.
Finally, a £25 gift card can be claimed when having an EV charger installed through Octopus.
“Existing Octopus customer? Find out how you can benefit too. T&Cs apply (only one switching offer per household)”
Or, if you just want to say thanks, you can buy me a coffee.
You can also see more ways to support the site here via the likes of Plusnet broadband, Smarty Mobile, Havenwise remote heat pump control, Hetzner Cloud hosting, Axle Energy, Quidco and more.
If you are thinking about a heat pump, check out my Trusted Heat Pump Installers page along with my guide How to Choose a Heat Pump Installer.
Follow @energystatsuk on Twitter / X, Bluesky and Mastodon for daily tariff graphs and updates.
Also, check out my Energy Unwrapped Podcast and please subscribe to my YouTube channel where podcast episodes and video articles will be published.
Note: The current and past performance of energy pricing is not necessarily a guide to the future.


