Heat Pump Performance History
This post will be updated on a monthly basis in the same vein as my Solar Generation History post. You can find solar stats going back to 2018 here:
My Solar Generation History
My 5kW Vaillant Arotherm heat pump was installed in October 2022 and you can find all the details about it in the following post.
My 5kW Vaillant Arotherm Heat Pump
Monitoring Setup
My monitoring setup is all based around Open Energy Monitor hardware and software along with a billing grade heat meter and electric meter.
https://openenergymonitor.org/
Which I make reference to in my ‘about’ blog post listed above where you can find more details.
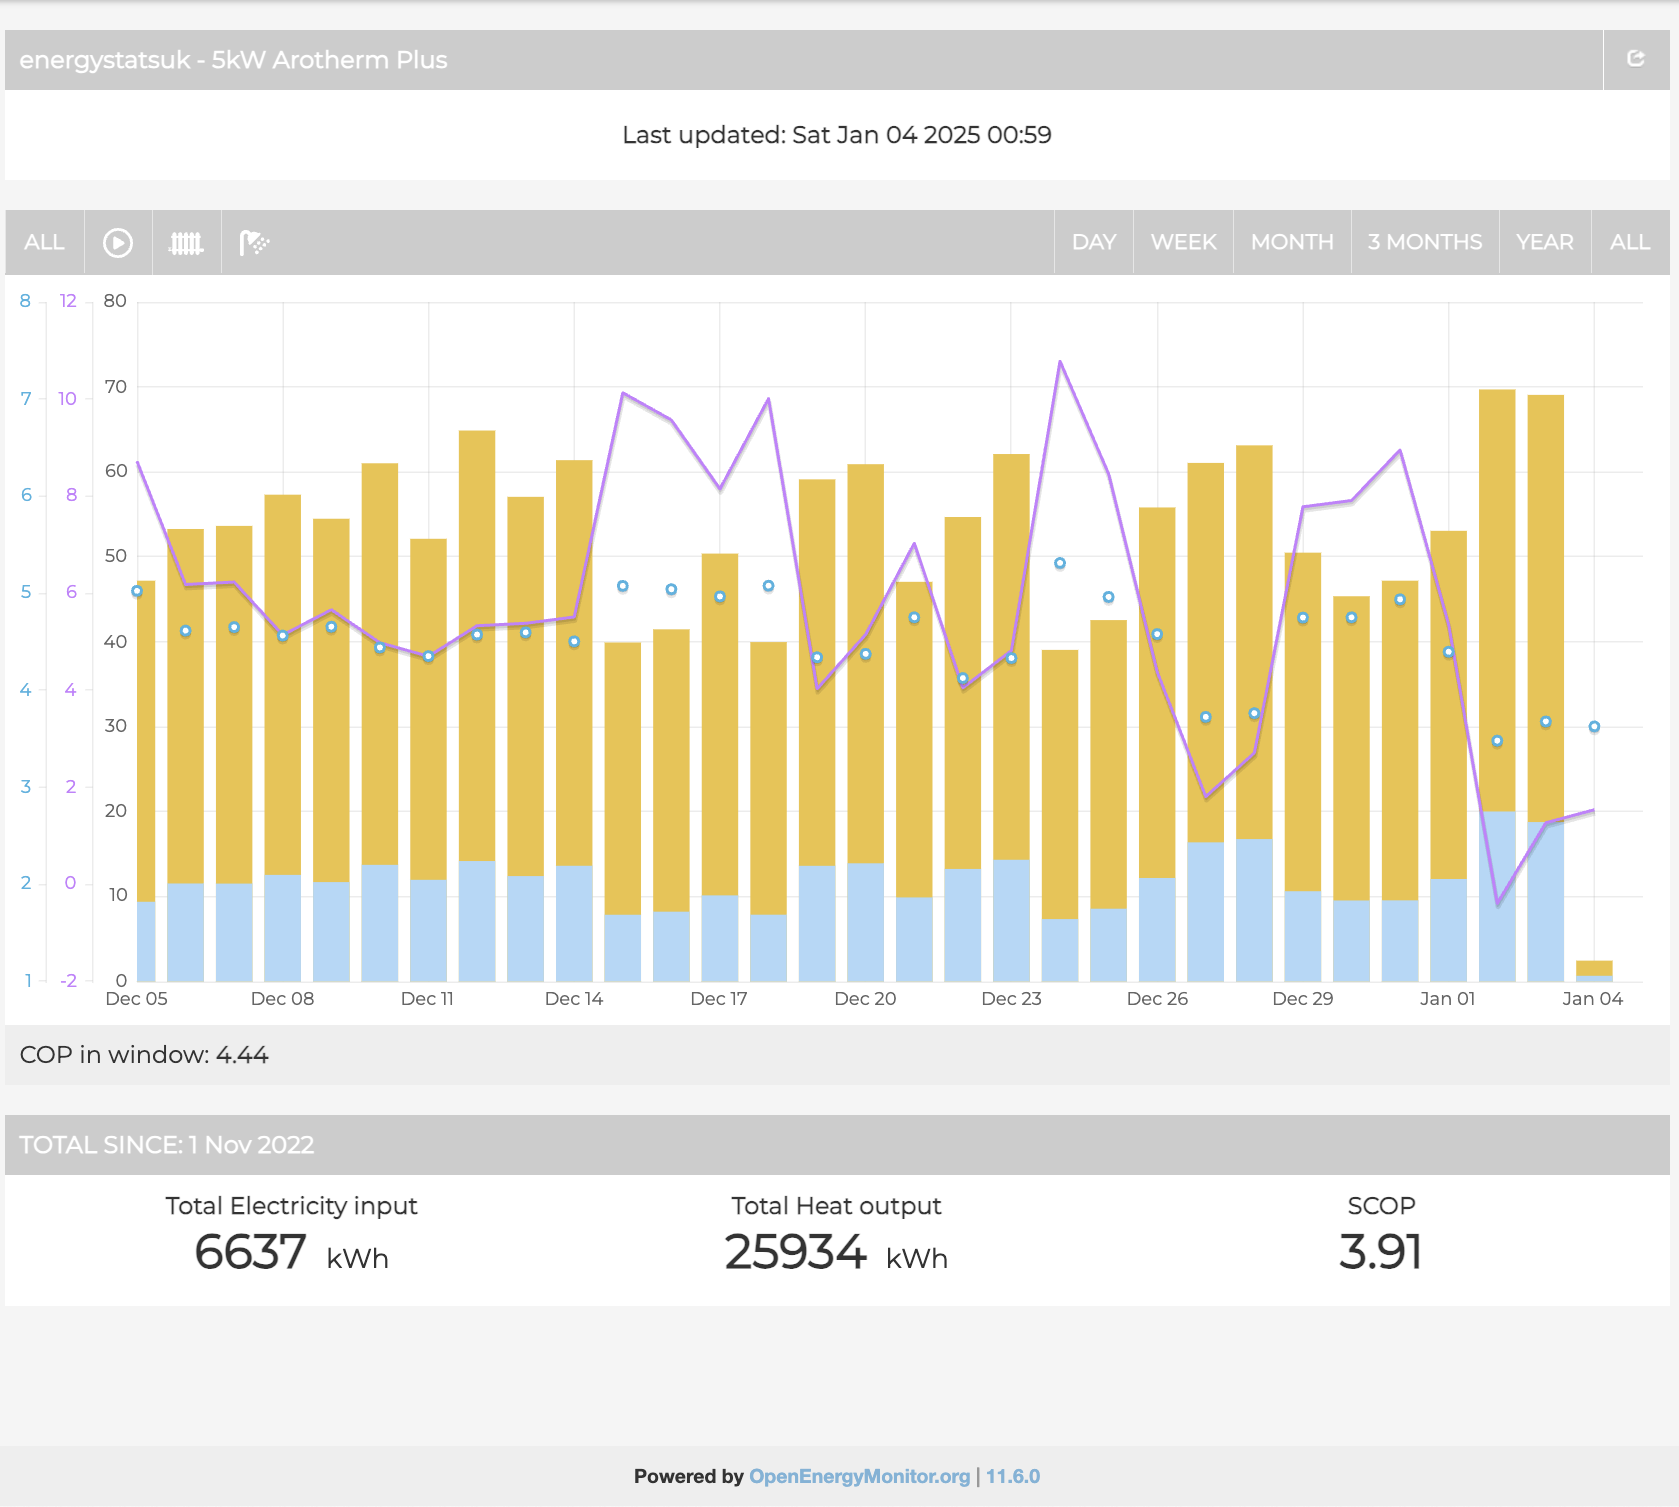
You can monitor every minute of every day of my heat pump performance on the following public dashboard:
https://emoncms.org/energystatsuk
And my heat pump is one of an ever growing number of heat pump installations being monitored by the Open Energy Monitor open source initiative called Heat Pump Monitor.
Full Year Stats
| Month / Year | Electric Input kWh | Heat Output kWh | COP |
| 2023 | 2856 | 10718 | 3.75 |
| 2024 | 2735 | 11559 | 4.23 |
Monthly Stats 2022
| Month / Year | Electric Input kWh | Heat Output kWh | COP | Outside Low | Outside Avg | Outside High | Avg Room |
| Nov-2022 | 344 | 1356 | 3.94 | 2.1 | 8.8 | 15.2 | 20.2 |
| Dec-2022 | 647 | 2195 | 3.39 | -3 | 4.3 | 12.1 | 20.3 |
Monthly Stats 2023
| Month / Year | Electric Input kWh | Heat Output kWh | Total COP | Heat COP | DHW COP | Outside Low | Outside Avg | Outside High | Avg Room | Heating % | DHW % |
| Jan-2023 | 569 | 2056 | 3.6 | -3.2 | 4.9 | 11.1 | 20.3 | ||||
| Feb-2023 | 390 | 1471 | 3.8 | -1.6 | 6.6 | 14.1 | 20.5 | ||||
| Mar-2023 | 393 | 1433 | 3.6 | -3.9 | 6.3 | 15.5 | 20.0 | ||||
| Apr-2023 | 205 | 848 | 4.1 | -1.4 | 8.4 | 17 | 19.6 | ||||
| May-2023 | 72 | 240 | 3.3 | 4.5 | 13.5 | 22.3 | 21.1 | ||||
| Jun-2023 | 40 | 124 | 3.1 | 6.9 | 17.4 | 29.3 | 22.8 | ||||
| Jul-2023 | 73 | 211 | 2.9 | 9.1 | 15.9 | 25.7 | 22.1 | ||||
| Aug-2023 | 79 | 247 | 3.1 | 8.5 | 16.3 | 25.7 | 22.4 | ||||
| Sep-2023 | 91 | 298 | 3.3 | 7.4 | 16.1 | 28.5 | 22.5 | 27 | 73 | ||
| Oct-2023 | 183 | 720 | 3.9 | 4.6 | 3.0 | 1.1 | 11.3 | 21.8 | 20.4 | 57 | 43 |
| Nov-2023 | 347 | 1366 | 3.9 | 4.4 | 2.9 | -2.5 | 6.5 | 13.3 | 19.8 | 87 | 17 |
| Dec-2023 | 414 | 1704 | 4.1 | 4.3 | 3.5 | -4.7C | 6 | 12.7 | 19.9 | 78 | 22 |
| Total | 2856 | 10718 | 3.8 | 4.4 | 3.1 | 10.8 | 21.0 | 62 | 39 |
Monthly Stats 2024
| Month / Year | Electric Input kWh | Heat Output kWh | Total COP | Heat COP | DHW COP | Outside Low | Outside Avg | Outside High | Avg Room | Heating % | DHW % |
| Jan-2024 | 503 | 1956 | 3.9 | 3.9 | 3.2 | -5.3 | 4.3 | 13.1 | 19.6 | 81 | 19 |
| Feb-2024 | 332 | 1409 | 4.2 | 4.5 | 3.4 | -0.8 | 7.1 | 15.7 | 19.7 | 78 | 22 |
| Mar-2024 | 318 | 1380 | 4.3 | 4.7 | 3.3 | -1.1 | 7.3 | 14.9 | 19.9 | 76 | 24 |
| Apr-2024 | 238 | 1011 | 4.2 | 4.7 | 3.4 | 0.3 | 9.2 | 18.9 | 20.1 | 69 | 31 |
| May-2024 | 103 | 421 | 4.1 | 5.4 | 3.9 | 6.2 | 14.4 | 23.9 | 20.9 | 32 | 68 |
| Jun-2024 | 101 | 412 | 4.1 | 5.2 | 3.8 | 4.9 | 15.0 | 27.0 | 21.3 | 35 | 65 |
| Jul-2024 | 79 | 326 | 4.1 | 5.4 | 4.5 | 7.1 | 16.7 | 27.8 | 21.8 | 16 | 84 |
| Aug-2024 | 65 | 247 | 3.8 | 5.5 | 4.2 | 7.1 | 16.5 | 25.5 | 21.9 | 13 | 87 |
| Sep-2024 | 117 | 509 | 4.4 | 5.1 | 4.3 | 2.8 | 12.7 | 22.8 | 20.6 | 40 | 60 |
| Oct-2024 | 180 | 837 | 4.7 | 5.2 | 4.2 | 1.2 | 10.2 | 16.2 | 19.9 | 58 | 42 |
| Nov-2024 | 343 | 1434 | 4.2 | 4.3 | 3.8 | -4.5 | 6.6 | 13.8 | 19.7 | 74 | 26 |
| Dec-2024 | 356 | 1617 | 4.5 | 4.7 | 4.0 | -0.6 | 6.4 | 12.8 | 19.8 | 75 | 25 |
| Total | 2735 | 11559 | 4.2 | 4.9 | 3.8 | 10.5 | 20.4 | 54 | 46 |
Monthly Stats 2025
| Month / Year | Electric Input kWh | Heat Output kWh | Total COP | Heat COP | DHW COP | Outside Low | Outside Avg | Outside High | Avg Room | Heating % | DHW % |
| Jan-2025 | 571 | 2055 | 3.6 | 3.8 | 3.0 | -5.4 | 2.6 | 10.0 | 19.9 | 80 | 20 |
| Feb-2025 | 453 | 1721 | 3.8 | 4.0 | 3.1 | -2.4 | 4.4 | 14.0 | 20.2 | 80 | 20 |
| Mar-2025 | 331 | 1332 | 4.0 | 4.3 | 3.4 | -2.6 | 7.0 | 16.5 | 20.3 | 75 | 25 |
| Apr-2025 | 180 | 723 | 4.0 | 4.6 | 3.5 | -0.3 | 10.2 | 23.2 | 20.1 | 64 | 36 |
| May-2025 | 106 | 381 | 3.6 | 4.5 | 3.5 | 1.3 | 13.0 | 22.3 | 21.0 | 29 | 71 |
| Jun-2025 | 72 | 251 | 3.5 | 5.3 | 3.7 | 7.5 | 17.4 | 29.2 | 22.4 | 3 | 97 |
| Jul-2025 | 64 | 231 | 3.6 | 0 | 3.7 | 9.8 | 18.2 | 29.7 | 22.9 | 0 | 100 |
| Aug-2025 | 61 | 192 | 3.1 | 0 | 3.4 | 10.1 | 17.3 | 29.8 | 22.2 | 0 | 100 |
| Sep-2025 | 99 | 368 | 3.7 | 4.7 | 3.5 | 3.2 | 8.7 | 15.6 | 19.8 | 33 | 67 |
| Oct-2025 | 185 | 774 | 4.2 | 4.9 | 3.5 | 2.4 | 10.8 | 17.8 | 20.0 | 63 | 37 |
| Nov-2025 | |||||||||||
| Dec-2025 | |||||||||||
| Total | 2122 | 8028 | 3.8 | 3.6 | 3.4 | 11.0 | 20.9 | 43 | 57 |
January Comparison
| Month / Year | Electric Input kWh | Heat Output kWh | Total COP | Heat COP | DHW COP | Outside Low | Outside Avg | Outside High | Avg Room | Heating % | DHW % |
| Jan-2023 | 569 | 2056 | 3.6 | -3.2 | 4.9 | 11.1 | 20.3 | ||||
| Jan-2024 | 503 | 1956 | 3.9 | 3.9 | 3.2 | -5.3 | 4.3 | 13.1 | 19.6 | 81 | 19 |
| Jan-2025 | 571 | 2055 | 3.6 | 3.8 | 3.0 | -5.4 | 2.6 | 10.0 | 19.9 | 80 | 20 |
February Comparison
| Month / Year | Electric Input kWh | Heat Output kWh | Total COP | Heat COP | DHW COP | Outside Low | Outside Avg | Outside High | Avg Room | Heating % | DHW % |
| Feb-2023 | 390 | 1471 | 3.8 | -1.6 | 6.6 | 14.1 | 20.5 | ||||
| Feb-2024 | 332 | 1409 | 4.2 | 4.5 | 3.4 | -0.8 | 7.1 | 15.7 | 19.7 | 78 | 22 |
| Feb-2025 | 453 | 1721 | 3.8 | 4.0 | 3.1 | -2.4 | 4.4 | 14.0 | 20.2 | 80 | 20 |
March Comparison
| Month / Year | Electric Input kWh | Heat Output kWh | Total COP | Heat COP | DHW COP | Outside Low | Outside Avg | Outside High | Avg Room | Heating % | DHW % |
| Mar-2023 | 393 | 1433 | 3.6 | -3.9 | 6.3 | 15.5 | 20.0 | ||||
| Mar-2024 | 318 | 1380 | 4.3 | 4.7 | 3.3 | -1.1 | 7.3 | 14.9 | 19.9 | 76 | 24 |
| Mar-2025 | 331 | 1332 | 4.0 | 4.3 | 3.4 | -2.6 | 7.0 | 16.5 | 20.3 | 75 | 25 |
April Comparison
| Month / Year | Electric Input kWh | Heat Output kWh | Total COP | Heat COP | DHW COP | Outside Low | Outside Avg | Outside High | Avg Room | Heating % | DHW % |
| Apr-2023 | 205 | 848 | 4.1 | -1.4 | 8.4 | 17 | 19.6 | ||||
| Apr-2024 | 238 | 1011 | 4.2 | 4.7 | 3.4 | 0.3 | 9.2 | 18.9 | 20.1 | 69 | 31 |
| Apr-2025 | 180 | 723 | 4.0 | 4.6 | 3.5 | -0.3 | 10.2 | 23.2 | 20.1 | 64 | 36 |
May Comparison
| Month / Year | Electric Input kWh | Heat Output kWh | Total COP | Heat COP | DHW COP | Outside Low | Outside Avg | Outside High | Avg Room | Heating % | DHW % |
| May-2023 | 72 | 240 | 3.3 | 4.5 | 13.5 | 22.3 | 21.1 | ||||
| May-2024 | 103 | 421 | 4.1 | 5.4 | 3.9 | 6.2 | 14.4 | 23.9 | 20.9 | 32 | 68 |
| May-2025 | 106 | 381 | 3.6 | 4.5 | 3.5 | 1.3 | 13.0 | 22.3 | 21.0 | 29 | 71 |
June Comparison
| Month / Year | Electric Input kWh | Heat Output kWh | Total COP | Heat COP | DHW COP | Outside Low | Outside Avg | Outside High | Avg Room | Heating % | DHW % |
| Jun-2023 | 40 | 124 | 3.1 | 6.9 | 17.4 | 29.3 | 22.8 | ||||
| Jun-2024 | 101 | 412 | 4.1 | 5.2 | 3.8 | 4.9 | 15.0 | 27.0 | 21.3 | 35 | 65 |
| Jun-2025 | 72 | 251 | 3.5 | 5.3 | 3.7 | 7.5 | 17.4 | 29.2 | 22.4 | 97 | 3 |
July Comparison
| Month / Year | Electric Input kWh | Heat Output kWh | Total COP | Heat COP | DHW COP | Outside Low | Outside Avg | Outside High | Avg Room | Heating % | DHW % |
| Jul-2023 | 73 | 211 | 2.9 | 9.1 | 15.9 | 25.7 | 22.1 | ||||
| Jul-2024 | 79 | 326 | 4.1 | 5.4 | 4.5 | 7.1 | 16.7 | 27.8 | 21.8 | 16 | 84 |
| Jul-2025 | 64 | 231 | 3.6 | 0 | 3.7 | 9.8 | 18.2 | 29.7 | 22.9 | 0 | 100 |
August Comparison
| Month / Year | Electric Input kWh | Heat Output kWh | Total COP | Heat COP | DHW COP | Outside Low | Outside Avg | Outside High | Avg Room | Heating % | DHW % |
| Aug-2023 | 79 | 247 | 3.1 | 8.5 | 16.3 | 25.7 | 22.4 | ||||
| Aug-2024 | 65 | 247 | 3.8 | 5.5 | 4.2 | 7.1 | 16.5 | 25.5 | 21.9 | 13 | 87 |
| Aug-2025 | 61 | 192 | 3.2 | 0 | 3.4 | 10.1 | 17.3 | 29.8 | 22.2 | 0 | 100 |
September Comparison
| Month / Year | Electric Input kWh | Heat Output kWh | Total COP | Heat COP | DHW COP | Outside Low | Outside Avg | Outside High | Avg Room | Heating % | DHW % |
| Aug-2023 | 79 | 247 | 3.1 | 8.5 | 16.3 | 25.7 | 22.4 | ||||
| Aug-2024 | 65 | 247 | 3.8 | 5.5 | 4.2 | 7.1 | 16.5 | 25.5 | 21.9 | 13 | 87 |
| Aug-2025 | 61 | 192 | 3.2 | 0 | 3.4 | 10.1 | 17.3 | 29.8 | 22.2 | 0 | 100 |
October Comparison
| Month / Year | Electric Input kWh | Heat Output kWh | Total COP | Heat COP | DHW COP | Outside Low | Outside Avg | Outside High | Avg Room | Heating % | DHW % |
| Oct-2023 | 183 | 720 | 3.9 | 4.6 | 3.0 | 1.1 | 11.3 | 21.8 | 20.4 | 57 | 43 |
| Oct-2024 | 180 | 837 | 4.7 | 5.2 | 4.2 | 1.2 | 10.2 | 16.2 | 19.9 | 58 | 42 |
| Oct-2025 | 185 | 774 | 4.2 | 4.9 | 3.5 | 2.4 | 10.8 | 17.8 | 20.0 | 63 | 37 |
November Comparison
| Month / Year | Electric Input kWh | Heat Output kWh | Total COP | Heat COP | DHW COP | Outside Low | Outside Avg | Outside High | Avg Room | Heating % | DHW % |
| Nov-2022 | 344 | 1356 | 3.9 | 2.1 | 8.8 | 15.2 | 20.2 | ||||
| Nov-2023 | 347 | 1366 | 3.9 | 4.4 | 2.9 | -2.5 | 6.5 | 13.3 | 19.8 | 87 | 17 |
| Nov-2024 | 343 | 1434 | 4.2 | 4.3 | 3.8 | -4.5 | 6.6 | 13.8 | 19.7 | 74 | 26 |
December Comparison
| Month / Year | Electric Input kWh | Heat Output kWh | Total COP | Heat COP | DHW COP | Outside Low | Outside Avg | Outside High | Avg Room | Heating % | DHW % |
| Dec-2022 | 647 | 2195 | 3.4 | -3 | 4.3 | 12.1 | 20.3 | ||||
| Dec-2023 | 414 | 1704 | 4.1 | 4.3 | 3.5 | -4.7C | 6.0 | 12.7 | 19.9 | 78 | 22 |
| Dec-2024 | 356 | 1617 | 4.5 | 4.7 | 4.0 | -0.6 | 6.4 | 12.8 | 19.8 | 75 | 25 |
Open Energy Monitor versus Vaillant Monitoring
With the help of the team at Open Energy Monitor I have been able to split out my hot water data from my heating data.
The way it was worked out means that all standby electricity is bundled with the heating data, leaving hot water data to just be that.
By splitting the figures I will now be able to show monthly breakdowns of each.
This also allows me to make monthly comparisons with the heating and hot water from two Vaillant built in sources; Working Figure and the myVaillant app.
I go into detail how to obtain the working figure in the dedicated article below:
How to Measure Vaillant Arotherm COP
| Open Energy Monitor (Heating and Standby) | Vaillant Working Figure | myVaillant App | Open Energy Monitor (Hot Water) | Vaillant Working Figure | myVaillant App | ||||||
| Month / Year | Electric Input kWh | Heat Output kWh | COP | Heating COP | Heating COP | Electric Input kWh | Heat Output kWh | COP | Hot Water COP | Hot Water COP | |
| Oct-2023 | 106 | 491 | 4.6 | 4.8 | 4.5 | 75 | 226 | 3.0 | 3.0 | 3.1 | |
| Nov-2023 | 232 | 1032 | 4.4 | 4.0 | 4.3 | 114 | 333 | 2.9 | 2.7 | 2.8 | |
| Dec-2023 | 306 | 1322 | 4.3 | 3.9 | 4.2 | 108 | 379 | 3.5 | 3.3 | 3.4 | |
| Open Energy Monitor (Heating and Standby) | Vaillant Working Figure | myVaillant App | Open Energy Monitor (Hot Water) | Vaillant Working Figure | myVaillant App | ||||||
| Month / Year | Electric Input kWh | Heat Output kWh | COP | Heating COP | Heating COP | Electric Input kWh | Heat Output kWh | COP | Hot Water COP | Hot Water COP | |
| Jan-2024 | 503 | 1955 | 3.9 | 3.7 | 3.9 | 114 | 380 | 3.3 | 3.2 | 3.2 | |
| Feb-2024 | 244 | 1090 | 4.5 | 4.2 | 4.3 | 85 | 313 | 3.7 | 3.4 | 3.6 | |
| Mar-2024 | 225 | 1047 | 4.7 | 4.2 | 4.5 | 92 | 328 | 3.6 | 3.3 | 3.5 | |
| Apr-2024 | 149 | 694 | 4.7 | 4.3 | 4.5 | 85 | 307 | 3.6 | 3.4 | 3.5 | |
| May-2024 | 25 | 136 | 5.4 | 4.4 | 4.6 | 69 | 274 | 4.0 | 3.9 | 4.0 | |
| Jun-2024 | 28 | 146 | 5.2 | 4.1 | 4.5 | 66 | 257 | 3.9 | 3.8 | 4.0 | |
| Jul-2024 | 10 | 54 | 5.4 | 2.5 | 2.5 | 63 | 267 | 4.2 | 4.5 | 4.5 | |
| Aug-2024 | 6 | 33 | 5.5 | 2.6 | 2.7 | 53 | 211 | 4.0 | 4.2 | 4.2 | |
| Sep-2024 | 40 | 204 | 5.1 | 4.3 | 4.4 | 66 | 275 | 4.2 | 4.3 | 4.3 | |
| Oct-2024 | 94 | 487 | 5.2 | 4.6 | 4.7 | 71 | 292 | 4.1 | 4.2 | 4.2 | |
| Nov-2024 | 239 | 1038 | 4.3 | 3.9 | 3.9 | 96 | 366 | 3.8 | 3.8 | 3.8 | |
| Dec-2024 | 252 | 1189 | 4.7 | 4.1 | 4.2 | 100 | 412 | 4.1 | 4.0 | 4.1 | |
| Year | 1815 | 8073 | 4.45 | 960 | 3682 | 3.84 | |||||
| Open Energy Monitor (Heating and Standby) | Vaillant Working Figure | myVaillant App | Open Energy Monitor (Hot Water) | Vaillant Working Figure | myVaillant App | ||||||
| Month / Year | Electric Input kWh | Heat Output kWh | COP | Heating COP | Heating COP | Electric Input kWh | Heat Output kWh | COP | Hot Water COP | Hot Water COP | |
| Jan-2025 | 437 | 1649 | 3.8 | 3.4 | 3.4 | 133 | 404 | 3.0 | 3.0 | 3.0 | |
| Feb-2025 | 337 | 1359 | 4.0 | 3.6 | 3.7 | 112 | 352 | 3.1 | 3.1 | 3.2 | |
| Mar-2025 | 223 | 967 | 4.3 | 3.8 | 3.9 | 100 | 338 | 3.4 | 3.3 | 3.4 | |
| Apr-2025 | 96 | 439 | 4.6 | 4.6 | 73 | 257 | 3.5 | 3.4 | |||
| May-2025 | 21 | 96 | 4.5 | 3.6 | 3.6 | 77 | 274 | 3.6 | 3.6 | 3.6 | |
| Jun-2025 | 2 | 7 | 5.3 | 1.6 | 1.6 | 66 | 243 | 3.7 | 3.9 | 3.9 | |
| Jul-2025 | 0 | 0 | 0.0 | 1.0 | 0.0 | 64 | 231 | 3.7 | 3.9 | 3.9 | |
| Aug-2025 | 0 | 0 | 0.0 | 1.0 | 0.0 | 61 | 192 | 3.4 | 3.6 | 3.7 | |
| Sep-2025 | 23 | 107 | 4.7 | 3.7 | 3.9 | 70 | 246 | 3.5 | 3.6 | 3.7 | |
| Oct-2025 | 92 | 449 | 4.9 | 4.5 | 4.5 | 81 | 285 | 3.5 | 3.5 | 3.6 | |
| Nov-2025 | |||||||||||
| Dec-2025 | |||||||||||
| Year | 1231 | 5073 | 4.12 | 837 | 2822 | 3.37 | |||||
What to Read Next?
If you’re interesting in reading more about my install or heat pumps in general i’d recommending heading into the blog section of the site.
In particular, take a look at the summary of our third winter with the heat pump.
There’s lots of great info and learnings in there.
Third Winter with our Vaillant Heat Pump
Referral information and free credit offer
If you find Energy Stats UK useful, there are a couple of easy ways to support the site and help cover hosting and server costs.
Thinking about switching energy suppliers?
Homeowners who join Octopus Energy using my referral link get £50 free credit after signing up. Business users get £100 free credit, and if you’re looking at solar or a heat pump, there’s also a £100 gift card through Octopus Tech.
Or, if you just want to say thanks, you can buy me a coffee.
You can also see more ways to support the site here via the likes of Plusnet broadband, Smarty Mobile, Havenwise remote heat pump control, Hetzner Cloud hosting and more.
Follow @energystatsuk on Twitter / X, Bluesky and Mastodon for daily tariff graphs and updates.
Note: The current and past performance of energy pricing is not necessarily a guide to the future.


One Comment