
Introduction
This “how much electricity does a heat pump use” article is inspired by the questions raised on a recent Gary Does Solar video about battery sizing. His video talked about what size home battery to buy and how to think about your historical electricity usage to help guide your decision.
I dived into the comments to remind Gary that any calculations you do based on your current usage (if using a gas boiler user) will be blown out of the water once you install a heat pump.
I had also briefly touched on this subject myself towards the end of my article Second winter with our Vaillant ASHP.
So in this post I am going to explain and help you calculate how much electricity a heat pump might use each day. Once you see those numbers it is much easier to understand what role, if any, a home battery can play. Historical usage is a useful starting point, but future usage with a heat pump is a completely different kettle of fish.
I have real world experience of making that move from a house with solar, battery and gas boiler to then transitioning over to a heat pump. I can share real world data to show the contrast.
Warning: this is a VERY technical article. There is no other way to explain all this without going pretty deep. Sorry, not sorry! LOL!
Table of Contents
How Much Gas Does a Boiler Use In a Day?
The reality of this question is that no cares (or cared).
Obviously, the bigger the house or the leakier the house in terms of heat loss, the more gas you’d need to heat it. You could burn through 100-200 kWh of gas on a cold day.
But gas was so cheap, that most people didn’t even check to see how much the boiler was using. It chucked out some heat into the house and they paid the bills.
How efficient was your gas boiler? Again, no one cared. And because the difference in performance (and running costs) between a good gas installation (85% to 95%) and a poor installation (maybe 65% to 75%) is negligible in terms of gas usage and cost, therefore no one really cared.
When I look back the price I was paying for gas back in 2020, it was less than 3p per kWh. The unit price on the October 2025 price cap is now 6.29p and even gas via Octopus Tracker tariff is hovering around 5.3p in the same time period.
So gas is now around twice the price it was a number of years ago. Yes, there was great work from the Nesta and The Heating Hub to promote lowering flow temperatures to increase boiler efficiency at the height of the energy crisis, post Ukraine. But still, I doubt the vast majority of people scrutinise their gas boiler usage.
Note: if you still have a gas boiler i’d recommend checking out those two articles as you might be able to make your system more efficient and reduce running costs.
But boy oh boy, do people obsess around the amount of electricity a heat pump uses.
There is justification for this though, primarily because of the spark gap (the difference between gas and electricity prices), which I cover more in Heat Pump Myths Busted.
And also because the yearly performance of the heat pump (SCOP) makes a massive difference to the running costs.
As we mentioned above, with gas boilers, a poor install might mean a small hit on efficiency of perhaps 70% instead of 85%. With heat pumps, the gap is far bigger: efficiency can vary from 250% to 500%.
That efficiency difference can lead to wildly different amounts of electricity being consumed via a heat pump.
In this article we will deep dive into why that is the case.
Before we move on, we can overcome the spark gap between gas and electricity by installing well designed heat pump systems. These systems can compete in running costs with gas or can be even cheaper to run than gas.
Throughout the whole of 2024 my heat pump performed at an efficiency of 4.23 (or 423%), so making it way cheaper than gas to run. And that’s without taking account the use of Solar PV, battery storage and the benefit of Time of Use smart tariffs.
Full details in my Whole House Running Costs & Stats 2024 article.
How much electricity does a heat pump use in a day?
This might sound like an instant cop out, but it “depends”.
The answer is not a fixed number. It depends on the size and heat loss of the house, the weather, the flow temperature, the hot water demand and the efficiency of the system and the heat pump unit itself.
In this article we will look at the maths behind the calculations with worked examples. We will be using manufacturers data and efficiency tables that I’ve previously researched in the article; smaller heat pumps will never reach the top of the SCOPs.
What To Expect
Gary’s video naturally leads to the next question: How big a battery do you need for a heat pump?
The truth is you can only answer that after looking at two other questions:
-
How much electricity does (or could) your heat pump use in a day?
-
How much electricity does your home already use?
This article tackles the first of those (how much electricity does a heat pump use).
We will walk through:
- how to estimate daily heat demand for your house
- how manufacturer COP tables translate that heat into electricity
- what the numbers look like for 5, 7 and 10 kW homes
- why flow temperature really matters
- how much hot water you use in the house (with calcuator)
- the realities of UK winter
- how all of this feeds back into the battery question
- and finally, the “Holy Trinity” ; Solar, Battery, and Heat Pump
For readers still using a gas boiler, there’s a quick guide on estimating what a heat pump would consume instead.
By the end you will see why a typical 13 kWh battery can help with tariff shifting and solar capture, but it can be just a tiny proportion of what a heat pump may need on a cold day. It is unlikely a battery of that size will fully cover a house’s heating, hot water and normal usage all at once.
Setting the Scene
Before jumping into numbers, let’s define a few basics we’ll use throughout.
Heat loss – Every house leaks heat. The rate depends on insulation, air-tightness, and surface area. Design heat loss is usually quoted in kW at a set outdoor temperature, often −3 °C outside with 21 °C inside.
Example: 7 kW at −3 °C outside / 21 °C inside
Flow temperature – The temperature of the water in your radiators or underfloor system. A 7 kW house might need 30-40 °C flow on mild days but 50–55 °C on freezing nights.
Coefficient of Performance (COP) – The ratio of heat output to electricity input. A 7 kW Vaillant at 7 °C outside might run at COP 4.8 with 35 °C flow, but only COP 3.0 at 55 °C flow.
Indoor set point – Most MCS designs assume 21 °C indoors. Dropping it by a degree or two reduces heat loss and daily use.
Hot water demand – A 250 L tank reheated twice a day with a heat pump might need around 5 kWh of electricity. For a family of four that can be a steady 4–8 kWh of electricity per day on top of heating.
Formula reference
-
Heat ÷ COP = Electricity used
-
Electricity × COP = Heat produced
Weather Compensation: Heat pumps with weather compensation just run in the background adjusting the flow temperature of the water in your radiators or underfloor heating depending on the outside temperature. See Vaillant aroTHERM Weather Curve & Heating Curve Guide.
Step 1: Work out the heat demand
We’ll start with the basics: how much heat your home needs to hold its indoor temperature when it’s cold outside.
That’s weather compensation in a nutshell, matching the heat your home loses to the outside against the heat your system produces. I went through this concept in Heat Pump Performance for Normal People.
If you’ve had a MCS heat pump installation, or have a quote for a heat pump, you may already have this figure from your design documents or quotation.
Example: a 7 kW House
Let’s say your house has a 7 kW design heat loss at −3 °C outside and 21 °C inside.
That’s a 24 °C difference (21 minus −3).
7000W / 24°C = 292 Watts per degree difference
This “watts per degree” number tells you how much extra power you need for every degree the outdoor temperature drops relative to indoors.
So for our 7 kW house:
-
Design heat loss: 7 kW at −3 °C
-
Per-degree loss: 292 W/°C
Example at 7 °C outside
Temperature difference = 21 (indoor) − 7 (outdoor) = 14 °C
292 x 14 = 4,088 W
Heat energy per day = 4,088 × 24 ÷ 1,000 = 98 kWh of heat
This is heat energy (kWh of heat), not electricity.
Example at 0 °C outside
Temperature difference = 21 (inside) − 0 (outside) = 21 °C
292 x 21 = 6,132 W
Heat energy per day = 6,132 × 24 ÷ 1,000 = 147 kWh of heat
Again, this is heat, not electricity. We’ll convert it next.
How Flow Temperature Affects Efficiency (COP)
Before we can move on to converting the amount of heat we need into how much electricity will be used we need to understand the relationship between Flow Temperature and performance of the heat pump.
Note: Flow Temperature is just a term used to indicate how warm the water is in your heating system (coming from the heat pump into the pipework, radiators and underfloor loops).
The relationship between flow and efficiency is quite simple;
- Lower flow = higher COP = less electricity.
- Higher flow = lower COP = more electricity
We can see this clearly in the following tables I created. This data was pulled straight from the Czech Gold Dust tables I refer to lots in the Top of the SCOPS article. This is raw Vaillant performance data. Whether your own setup can reach these COP figures depends on how well the system design is and the specification of the unit itself.
Most R290 systems ‘should’ be able to hit most of these numbers.
My system closely matches the specification up to 10 °C outside or below. But I find the 12 °C and 15 °C numbers a bit pie in the sky and unrealistic (too high).
Vaillant 5 kW aroTHERM Plus – COP
| Outside temp (°C) | 35 °C flow | 45 °C flow | 55 °C flow |
|---|---|---|---|
| −2 | 3.5 | 2.9 | 2.3 |
| 0 | 3.7 | 3.1 | 2.5 |
| 2 | 4.0 | 3.3 | 2.6 |
| 7 | 4.8 | 3.7 | 3.0 |
| 10 | 5.4 | 4.0 | 3.2 |
| 12 | 5.8 | 4.3 | 3.4 |
| 15 | 6.5 | 4.7 | 3.7 |
Vaillant 7 kW aroTHERM Plus – COP
| Outside temp (°C) | 35 °C flow | 45 °C flow | 55 °C flow |
|---|---|---|---|
| −2 | 3.3 | 2.8 | 2.2 |
| 0 | 3.8 | 3.1 | 2.5 |
| 2 | 4.2 | 3.4 | 2.7 |
| 7 | 4.8 | 3.7 | 3.0 |
| 10 | 5.4 | 4.0 | 3.2 |
| 12 | 5.9 | 4.4 | 3.5 |
| 15 | 6.6 | 4.7 | 3.7 |
Vaillant 10 kW aroTHERM Plus – COP
| Outside temp (°C) | 35 °C flow | 45 °C flow | 55 °C flow |
|---|---|---|---|
| −2 | 3.5 | 2.9 | 2.4 |
| 0 | 3.9 | 3.2 | 2.6 |
| 2 | 4.3 | 3.5 | 2.8 |
| 7 | 5.0 | 3.9 | 3.1 |
| 10 | 5.6 | 4.2 | 3.4 |
| 12 | 6.1 | 4.5 | 3.6 |
| 15 | 6.8 | 4.9 | 3.9 |
As you can see in all the tables, the lower the temperature of the water in the system, the better the efficiency.
The higher the water temperature, the harder the heat pump has to work to get the water to that temperature. As such, it’s not as efficient.
Step 2: Convert Heat Into Electricity
Now that we have the efficiency data (COP) and heat demand, we can calculate how much electricity is required.
Formula:
Heat (kWh) / COP = Electricity (kWh)
Example for the 7 kW House
At 7 °C outside
| Flow Temp | COP | Heat (kWh) | Electricity (kWh/day) |
|---|---|---|---|
| 35 °C | 4.8 | 98 | 20 |
| 45 °C | 3.7 | 98 | 27 |
| 55 °C | 3.0 | 98 | 33 |
→ Range: 20 to 33 kWh electricity per day depending on flow temperature.
At 0 °C outside
| Flow Temp | COP | Heat (kWh) | Electricity (kWh/day) |
|---|---|---|---|
| 35 °C | 3.8 | 147 | 39 |
| 45 °C | 3.1 | 147 | 47 |
| 55 °C | 2.5 | 147 | 59 |
→ Range: 39 to 59 kWh electricity per day depending on flow temperature.
Daily Heat-Only Electricity Usage
Using the variety of data points we’ve gone through and explained:
- Heat Loss
- Flow Temperature
- COP (efficiency)
We can build a set of tables for each of the 3 example heat losses; 5kW, 7kW and 10kW.
Showing the amount of electricity required across different temperature days and depending on the flow temperature of the system on those days.
Daily electricity use for a house with 5 kW heat loss at −3 °C design conditions (21 °C indoors)
| Outside temp (°C) | ΔT | Heat (kWh/day) | 35 °C flow (elec kWh/day) | 45 °C flow (elec kWh/day) | 55 °C flow (elec kWh/day) |
|---|---|---|---|---|---|
| −2 | 23 | 115 | 33 | 40 | 50 |
| 0 | 21 | 105 | 28 | 34 | 42 |
| 2 | 19 | 95 | 23 | 29 | 37 |
| 7 | 14 | 70 | 15 | 19 | 23 |
| 10 | 11 | 55 | 10 | 14 | 17 |
| 12 | 9 | 45 | 8 | 10 | 13 |
| 15 | 6 | 30 | 5 | 7 | 8 |
Daily electricity use for a house with 7 kW heat loss at −3 °C design conditions (21 °C indoors)
| Outside temp (°C) | ΔT | Heat (kWh/day) | 35 °C flow (elec kWh/day) | 45 °C flow (elec kWh/day) | 55 °C flow (elec kWh/day) |
|---|---|---|---|---|---|
| −2 | 23 | 161 | 49 | 58 | 70 |
| 0 | 21 | 147 | 39 | 47 | 59 |
| 2 | 19 | 133 | 33 | 40 | 49 |
| 7 | 14 | 98 | 20 | 27 | 33 |
| 10 | 11 | 77 | 14 | 21 | 27 |
| 12 | 9 | 63 | 11 | 17 | 21 |
| 15 | 6 | 42 | 7 | 11 | 14 |
Daily electricity use for a house with 10 kW heat loss at −3 °C design conditions (21 °C indoors)
| Outside temp (°C) | ΔT | Heat (kWh/day) | 35 °C flow (elec kWh/day) | 45 °C flow (elec kWh/day) | 55 °C flow (elec kWh/day) |
|---|---|---|---|---|---|
| −2 | 23 | 230 | 66 | 79 | 97 |
| 0 | 21 | 210 | 55 | 68 | 84 |
| 2 | 19 | 190 | 45 | 56 | 68 |
| 7 | 14 | 140 | 28 | 36 | 45 |
| 10 | 11 | 110 | 20 | 26 | 32 |
| 12 | 9 | 90 | 15 | 20 | 25 |
| 15 | 6 | 60 | 9 | 13 | 15 |
Compare electricity usage across all houses
5 kW Heat Loss House:
-
30 to 45 kWh/day at -0 °C
- 10 to 15 kWh/day at 10 °C
7kW Heat Loss House:
-
40 to 60 kWh/day at 0 °C
- 15 to 25 kWh/day at 10 °C
10kW Heat Loss House:
- 55 to 85 kWh/day at 0 °C
-
20 to 25 kWh/day at 10C °C
Why Flow Temperature Matters and Weather Compensation
These tables make one thing clear. Flow temperature is the main factor that affects your electricity use with a heat pump.
Have exactly the same house and weather, but reduce the flow temperature from 55 °C to 35 °C, and you can slash the amount of electricity the heat pump needs in a day.
In real systems, flow temperature isn’t fixed. Weather compensation means the heat pump adjusts as outdoor temperature changes.
See Heat Pump Performance for Normal People for a simple explanation of how this works.
Still, the rule applies: the lower your average flow temperature, the less electricity you’ll use.
That’s why radiator sizing and insulation matter so much.
-
Bigger radiators or underfloor loops can deliver the same comfort at lower flow temperatures.
-
Better insulation and airtightness reduce heat loss, so you can use lower flow temperatures too.
Both make it easier to keep your heat pump efficient and cut daily electricity use.
How Do You Know What Flow Temperature to Use?
If you don’t yet have a heat pump, use 55 °C as a worst-case flow temperature, and remember, because of weather compensation, 55 °C is only needed for around −3 °C outdoors (or whatever the coldest outside temperature your system has been designed for).
If you already have a heat pump, you should have this type of design information from the MCS documentation. Something like 50 °C flow when -3 °C and 21 °C indoors.
As the weather gets milder, the flow temperature should drop automatically through weather compensation, which boosts efficiency.
A well-designed system should rarely need 55 °C flow, even at −3 °C.
And as we’ll see next, most UK winter days aren’t anywhere near that cold on a consistent basis.
UK Winter Reality
Some of the numbers in the tables about how much electricity is required each day can look alarming, especially when −3 °C outside. But those conditions are design points, not normal winter days. The UK winter is mostly mild as we can see from this long term historical data.
Average Daily Mean Temperatures (°C)
| Month | Motherwell | Sheffield | Oxford |
|---|---|---|---|
| November | 6.0 | 7.3 | 7.9 |
| December | 4.0 | 5.0 | 5.4 |
| January | 3.0 | 4.6 | 5.2 |
| February | 3.0 | 4.9 | 5.5 |
| March | 5.0 | 6.7 | 7.5 |
| April | 7.0 | 9.2 | 9.9 |
| Nov–Apr mean | 4.7 | 6.3 | 9.5 |
Days That Stay Below Freezing
| Location | Nov | Dec | Jan | Feb | Mar | Apr | Total |
|---|---|---|---|---|---|---|---|
| Motherwell | 0 | 2 | 3 | 2 | 1 | 0 | ≈ 8 |
| Sheffield | 0 | 1 | 2 | 1 | 0 | 0 | ≈ 4 |
| Oxford | 0 | 0 | 1 | 0 | 0 | 0 | ≈ 1 |
Frost (and sub zero) overnight is common, but it usually warms above freezing after sunrise.
True “all-day freezing” and ” 24 hour sub-zero” conditions are rare, about eight days per winter in central Scotland, four in Sheffield, and maybe one in Oxford.
This matters because your heat pump spends most of the winter running efficiently in the 3 °C to 6 °C range and beyond, not always at −3 °C.
The -3 °C design figures are useful for system sizing, but they’re not your day-to-day reality.
(Source: Heat Pump Myths – Do Heat Pumps Work in Scotland’s Winter?)


Step 3: Hot Water
Space heating isn’t the whole story as to how much electricity your heat pump uses. Domestic hot water (DHW) adds its own energy use each day.
Simple Hot Water Heat Calculation
- Heat to raise water = litres × temperature rise × 0.001163 kWh
- For example, heating water from 10 °C to 50 °C means a 40 °C rise.
- Each litre takes about 0.0465 kWh of heat.
Quick Reference: Heating from 10 °C → 50 °C (ΔT = 40 °C)
| Volume | Heat Needed (kWh) | Electricity at COP 3 (kWh) |
|---|---|---|
| 100 L | ~4.7 | ~1.6 |
| 200 L | ~9.3 | ~3.1 |
| 300 L | ~14.0 | ~4.7 |
| 400 L | ~18.6 | ~6.2 |
| 500 L | ~23.3 | ~7.8 |
Example: Showers
A 10-minute shower at 6 L/min uses roughly 60 L of hot water.
So four showers = 240 L
-
Heat ≈ 240L × 0.0465 = 11.2 kWh
-
Electricity at COP 3 ≈ 3.7 kWh
Obviously, the amount of heat (and electricity) required to heat water depends on many factors. Starting point, target temp etc.
Also, you can store water at higher temperatures than required to give yourself more usable water. I covered this in Hot Water Cylinder Sizing and Mixing.
Real-World DHW Usage (Family of Four)
From my own system (two adults, two teenagers, 250 L Mixergy cylinder reheated twice daily):
-
Total 2024 electricity: 1,765 kWh
-
Total heat output: 7,838 kWh
Per day average:
- 4.8 kWh of electricity
- 21.5 kWh of hot water heat
Around 25% of our total yearly heat goes into hot water.
Our hot water use averages around 5 kWh of electricity per day, which stays consistent through the year.
If your household is smaller, expect less than that.
Adding DHW to the 7 kW House Example
Let’s add hot water (about 5 kWh/day) to the earlier space heating results.
At 7 °C outside:
-
35 °C flow: 20 + 5 = 25 kWh electricity per day
-
45 °C flow: 27 + 5 = 32 kWh electricity per day
-
55 °C flow: 33 + 5 = 38 kWh electricity per day
At 0 °C outside:
-
35 °C flow: 39 + 5 = 44 kWh electricity per day
-
45 °C flow: 47 + 5 = 52 kWh electricity per day
-
55 °C flow: 59 + 5 = 64 kWh electricity per day
So hot water is a fairly predictable add-on, usually 3 to 6 kWh/day of electricity depending on your usage and the heat pump’s COP.
Easy Hot Water Wins with Tariffs
Hot water is flexible. You can time it. That makes DHW perfect for cheap rate windows on time-of-use tariffs.
-
Run cylinder heats during off-peak hours.
-
Schedule hot water during tariff dips if your plan allows it.
-
Time DHW runs with solar output on bright days.
See Best Heat Pump Tariff for examples using Octopus Cosy or Intelligent Octopus Go.
For more efficiency tips heating hot water with a heat pump, see my Golden Rules and hot water settings here: Best Heat Pump Hot Water Settings.
Hot Water Calculator
Enter your cold and hot water temps, the litres you’re heating, your heat pump’s power output and COP of the hot water run.
The tool calculates heat added to the water in kWh using Litres × ΔT × 0.001163, the electrical energy as Heat ÷ COP, and the time as Heat ÷ Power Output, then shows Electrical input, Heat output, and Time taken (hh:mm).
Defaults are 200 L from 10 °C to 50 °C, COP 3.0, and 5 kW power.
COP is also checked by Heat ÷ Electrical so you can confirm the numbers.
Hot Water Calculator
Enter your values. The calculator assumes water is 1 kg/L and specific heat is 4.186 kJ/kg·°C. 1 kWh = 3,600 kJ.
Electrical input
–
Heat output
–
Time taken (hours:mins)
–
COP check: Heat ÷ Electrical = – (should match the COP you entered)
Show formulas
Heat (kWh) = Litres × ΔT × 0.001163
Electrical (kWh) = Heat ÷ COP
Time (hours) = Heat ÷ Thermal power output
Real-World Heating and COP Example: Our 4 kW Heat Loss House
My own design heat loss is around 4 kW, with roughly 40 °C flow at −3 °C (My 5kW Vaillant Heat Pump)
Below is how the system actually did through winter 2023/24. So each day analysed from November 2023 to end of April 2024.
I then averaged out the data into 1 °C temperature bands showing Electricity required, Heat Output and the COP my system achieved.
Property: 1930s semi-detached, three bedrooms, about 100 m², located in Sheffield.
See: Second Winter with Our Vaillant ASHP.
Heat Only (Electricity and Heat Output) Daily Results by Temperature Band (Winter 2023/2024)
| Avg Daily Temp | Electricity kWh | Heat Output kWh | Avg Heating COP | Number of Days |
| -2C to -1C | 23.3 | 72.7 | 3.1 | 5 |
| -1C to 0C | 21.2 | 69.3 | 3.3 | 5 |
| 0C to 1C | 19.7 | 66.2 | 3.4 | 4 |
| 1C to 2C | 18.2 | 64.2 | 3.5 | 5 |
| 2C to 3C | 14.6 | 57.6 | 3.9 | 8 |
| 3C to 4C | 13.8 | 56.0 | 4.1 | 14 |
| 4C to 5C | 11.3 | 48.8 | 4.3 | 16 |
| 5C to 6C | 10.0 | 45.4 | 4.5 | 20 |
| 6C to 7C | 8.3 | 38.9 | 4.7 | 29 |
| 7C to 8C | 7.2 | 34.8 | 4.8 | 23 |
| 8C to 9C | 6.6 | 32.7 | 5.0 | 20 |
| 9C to 10C | 5.6 | 28.6 | 5.1 | 22 |
| 10C to 11C | 4.6 | 23.7 | 5.2 | 13 |
| 11C to 12C | 4.0 | 21.6 | 5.4 | 6 |
| 12C to 13C | 2.5 | 13.1 | 5.3 | 3 |
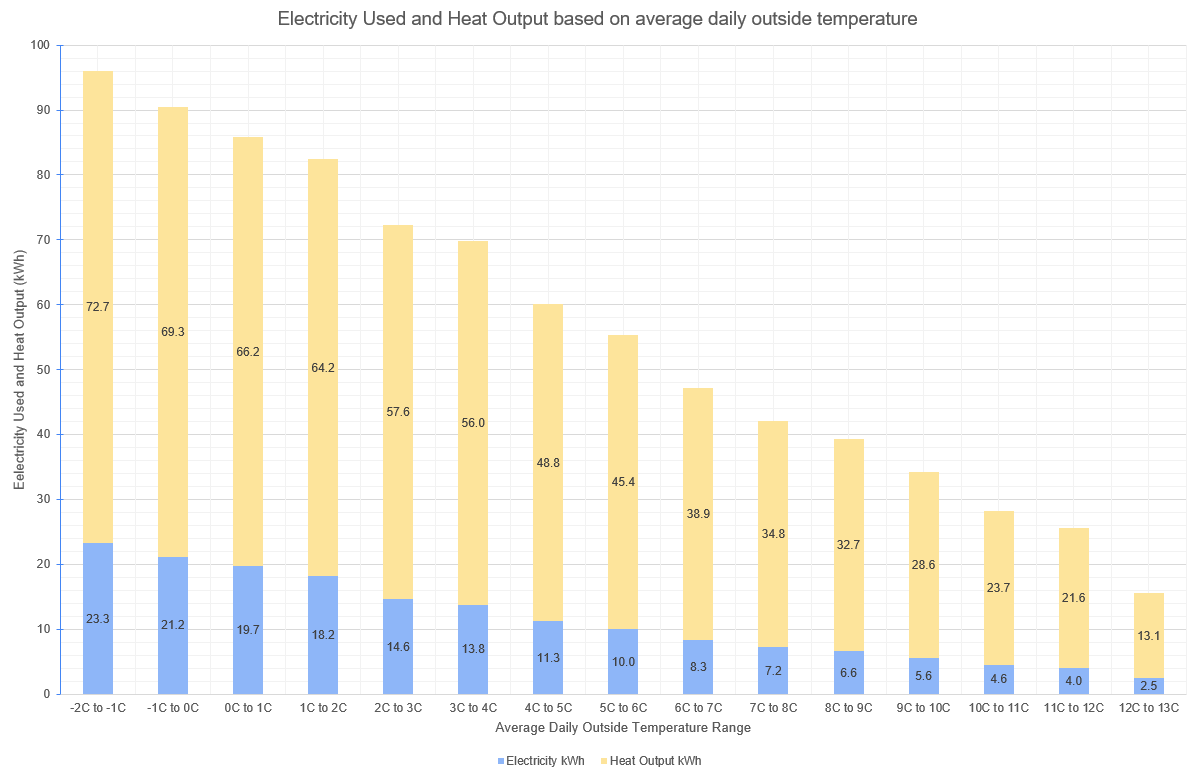
What this shows: as the outside temperature rises, daily electricity use drops sharply while the COP climbs.
This matches the pattern from the earlier tables, just scaled down because this is a slightly lower-loss house.
Real Word Tables for 5kW, 7kW and 10kW heat loss
Let’s use my 4kW heat loss as a base and scale up tables for each of 5kW, 7kW and 10kW heat loss.
5kW Heat Only kWh by Temperature Band (scaled up from my 4kW data)
| Avg Daily Temp | Electricity kWh | Heat Output kWh |
| -2C to -1C | 29 | 91 |
| -1C to 0C | 26 | 87 |
| 0C to 1C | 25 | 83 |
| 1C to 2C | 23 | 80 |
| 2C to 3C | 18 | 72 |
| 3C to 4C | 17 | 70 |
| 4C to 5C | 14 | 61 |
| 5C to 6C | 12 | 57 |
| 6C to 7C | 10 | 49 |
| 7C to 8C | 9 | 44 |
| 8C to 9C | 8 | 41 |
| 9C to 10C | 7 | 36 |
| 10C to 11C | 6 | 30 |
| 11C to 12C | 5 | 27 |
| 12C to 13C | 3 | 16 |
7kW Heat Only kWh by Temperature Band (scaled up from my 4kW data)
| Avg Daily Temp | Electricity kWh | Heat Output kWh |
| -2C to -1C | 41 | 127 |
| -1C to 0C | 37 | 121 |
| 0C to 1C | 34 | 116 |
| 1C to 2C | 32 | 112 |
| 2C to 3C | 26 | 101 |
| 3C to 4C | 24 | 98 |
| 4C to 5C | 20 | 85 |
| 5C to 6C | 17 | 79 |
| 6C to 7C | 15 | 68 |
| 7C to 8C | 13 | 61 |
| 8C to 9C | 12 | 57 |
| 9C to 10C | 10 | 50 |
| 10C to 11C | 8 | 41 |
| 11C to 12C | 7 | 38 |
| 12C to 13C | 4 | 23 |
10kW Heat Only kWh by Temperature Band (scaled up from my 4kW data)
| Avg Daily Temp | Electricity kWh | Heat Output kWh |
| -2C to -1C | 58 | 182 |
| -1C to 0C | 53 | 173 |
| 0C to 1C | 49 | 165 |
| 1C to 2C | 46 | 160 |
| 2C to 3C | 37 | 144 |
| 3C to 4C | 34 | 140 |
| 4C to 5C | 28 | 122 |
| 5C to 6C | 25 | 113 |
| 6C to 7C | 21 | 97 |
| 7C to 8C | 18 | 87 |
| 8C to 9C | 16 | 82 |
| 9C to 10C | 14 | 71 |
| 10C to 11C | 11 | 59 |
| 11C to 12C | 10 | 54 |
| 12C to 13C | 6 | 33 |
Real World Takeaway
Real homes behave like the tables predict, scaled by your specific heat loss and flow temperatures.
Most UK winter days fall in the 3–10 °C range, so your heat pump spends a lot of time in the higher-COP, lower-kWh zone.
You can compare real data from other homes on HeatPumpMonitor.org. Look for properties with similar size, age, and location.
Warning: these extrapolated tables (5kW, 7kW and 10kW) are based on my COP for my system and just scaled. Reminder that mine is a system with a 4kW heat loss, 20 °C indoor target and 40 °C flow temp at -3 °C outside. Your system will probably not be an exact match to this, so be sure to take into account the different COP values at different flow temperatures when investigating and calculating.
If You Have Gas Data and No Heat Pump Yet
You can estimate future electricity use from past gas data on a cold day.
Here’s a simple reverse-engineer method.
Step 1: Choose a pretty cold day (close to zero °C)
Pick a day when:
-
the heating was on all day, and
-
the average outside temperature was around 2 °C or below.
If you have a smart meter, you can usually get daily kWh figures from your supplier.
We will need the daily kWh of gas used as well, the average outside temperature for the day chosen and the average internal temperature.
Example Calculation:
- Gas used: 118 kWh
- Average Outside Temperature: 0 °C
- Average Inside Temperature: 21 °C
- Boiler efficiency: 85% → about 100 kWh of useful heat (118 x 0.85)
- Subtract ~8 kWh heat for hot water (around 175L, 10 °C to 50 °C) → Leaves 92 kWh of ‘heat’ for space heating
Step 2: Find the Daily Power Loss Rate
Average power = 92 kWh of heat ÷ 24 = 3.83 kW
Temperature difference = 21 (inside) − 0 (outside) = 21 °C
Watts per degree: 3830 / 21 = 182 W per degree
This 182 W per degree figure becomes key in determining how much electricity is used at various other outside temperatures.
At 0 °C outside:
Electricity required:
-
At COP 2.5 → 92 kWh of heat ÷ 2.5 = 36.8 kWh electricity (55 °C Flow)
-
At COP 3.1 → 92 kWh of heat ÷ 3.1 = 29.7 kWh electricity (45 °C Flow)
- At COP 3.8 → 92 kWh of heat ÷ 3.8 = 24.2 kWh electricity (35 °C Flow)
Then add your DHW electricity on top.
Step 3: Estimate for Milder Days
At 7 °C outside:
21 (indoors) – 7 (outdoors)= 14 °C → 182 × 14 = 2.55 kW
Daily space heat = 2.55 × 24 = 61.2 kWh
Electricity required:
-
At COP 3.1 → 61.2 kWh of heat ÷ 3.1 = 19.7 kWh electricity (55 °C Flow)
-
At COP 3.9 → 61.2 kWh of heat ÷ 3.9 = 15.7 kWh electricity (45 °C Flow)
- At COP 5.0 → 61.2 kWh of heat ÷ 4.6 = 12.2 kWh electricity (35 °C Flow)
Then add your DHW electricity on top.
This “gas reverse-engineer” trick is a useful shortcut, but it’s not a substitute for a proper room-by-room heat loss calculation and full system design.
Always get advice from a heating engineer who understands both design heat loss and system configuration.
Gas → Heat Pump Daily Electricity Calculator
Use one cold day of gas data to estimate how much electricity a heat pump might use. All units are metric.
How Big a Battery Do You Need for a Heat Pump?
This ties back to the question that Gary asked in his video.
Looking at the tables we created earlier, a mid-sized 7 kW house can need 40–60 kWh of electricity from just the heat pump on a cold day when 0 °C all day.
A 10 kW house can be higher still.
A 13 kWh battery is only a small fraction of what could be required, and that’s before adding hot water or normal household loads.
So the real role of a home battery isn’t to run the heat pump completely. It’s to shift costs and store cheap or solar electricity.
A 13 kWh battery can smooth out many winter days, lowering your average cost per kWh by:
-
charging when electricity is cheap, and
-
running the house from that stored energy later.
That’s what makes smart tariffs worthwhile. See my Best Heat Pump Tariff article around strategies, technology and different tariffs available to run your heat pump.
Batteries and Time of Use Tariffs
Covering an entire winter day’s heating purely from a battery is hard unless your house is small or your battery is very large.
You can still make it work financially by:
-
letting the heat pump heat water and top up space heat during cheap-rate windows (like Intelligent Octopus Go’s 6-hour window) and charging the battery at the same time
-
using multi-window tariffs (like Octopus Cosy) to schedule hot water heats and battery recharges through the day
-
avoiding discharging the battery during those same cheap-rate periods.
Only the biggest budgets could justify a battery large enough to handle the rare coldest days. Oversizing for that small slice of winter usually leaves you with unused capacity the rest of the year.
And remember, most of the heating season sits between 3 °C and 8 °C, not −3 °C. Those very cold days with very high daily electricity usage are the exception.
A well-sized battery still adds plenty of value even if it can’t carry you through the absolute coldest days.
Just accept this and be at peace with the fact that you’ll still need to pull from the grid on freezing days.
I feel the best goal is to lower your average imported unit cost across the whole winter, not eliminate grid use entirely.
I covered the concept about average or blended imported costs in SCOP versus Pounds and Pence.
Learn more about Time of Use (TOU) tariffs in my guide to Octopus smart tariffs.
If you do decide to change your supplier to Octopus Energy, you can claim £50 free credit when switching using my referral link. Thank you if you decide to do that.
The “Holy Trinity” ; Solar, Battery, and Heat Pump
If you already have solar and are considering a heat pump, it becomes a bit of a no brainer, especially if you can add a battery too.
You can’t be “smart” with gas. You can’t buy “off-peak gas” or generate it yourself with solar PV or store it in batteries. All of which can make heat pumps both smarter and cheaper to run.
Through the whole of 2024, my 5,1kW solar installation generated more energy than my heat pump needed for seven months of the year. And solar still made a contribution in the other five months of winter.
Solar Generation versus Heat Pump Usage in 2024
| Heat Pump Usage (kWh) | Solar Gen (kWh) | Shortfall (kWh) | |
| Month | |||
| January | 512 | 115 | 397 |
| February | 330 | 145 | 185 |
| March | 339 | 263 | 76 |
| April | 241 | 388 | -147 |
| May | 103 | 449 | -346 |
| June | 101 | 531 | -430 |
| July | 78 | 509 | -431 |
| August | 64 | 457 | -393 |
| September | 117 | 257 | -140 |
| October | 180 | 243 | -63 |
| November | 343 | 121 | 222 |
| December | 356 | 83 | 273 |
| Total | 2764 | 3561 | -797 |
See more breakdown via Whole House Running Costs and Stats 2024.
If you don’t have solar or batteries and are considering a purchase, then I highly recommend the Gary Does Solar YouTube Channel. It’s an amazing resource.
Conclusion
A heat pump’s electricity use comes down to two things: how much heat your home needs and the COP on the day. As we’ve discussed, this isn’t a straightforward calculation and is different for every home.
But I hope the detail in this article has helped you understand how all the variables connect up the dots.
If you want to see live and historical data from my system it’s published on emoncms.org. You can also browse lots of other installations on the Heat Pump Monitor website.
These links from Open Energy Monitor have been invaluable for examining my own system performance over the years.
If you have a Vaillant heat pump, you can find my full collection of posts here:
Vaillant aroTHERM Heat Pump Guide that might help you get more performance and comfort from your system.
FAQ
How much electricity does a heat pump use?
It depends on heat loss, outdoor temperature, and COP. Use one cold day of gas data to estimate space heat, then divide by COP to get kWh.
How do I estimate heat pump kWh from my gas data?
Pick a cold day, multiply gas by boiler efficiency to get useful heat, subtract hot-water heat, divide by 24 for kW, relate to ΔT to get loss rate, then scale to other days and divide by COP.
What COP should I use for estimates?
Start with your measured COP vs outdoor temperature. If you only have tables, pick the COP for your flow temperature and interpolate by outdoor temp.
Does indoor set point change electricity use?
Yes. Every extra degree indoors increases heat demand roughly in proportion to the indoor–outdoor difference.
How does flow temperature affect COP?
Lower flow temperature usually raises COP. Bigger emitters or weather compensation let you run lower flow, which cuts kWh.
How do I separate hot water from space heating?
Estimate daily DHW heat (for many homes 3–6 kWh electricity) and add it to the space-heating electricity to get a total.
Why do numbers jump on very cold days?
Heat loss grows with ΔT and COP falls as it gets colder, so electricity rises twice over: more heat needed and lower efficiency.
Will my heat pump cycle at mild temperatures?
Possibly. If minimum modulation is higher than the heat required, it will cycle. Better control and lower flow reduce cycling.
How accurate is this calculator?
It’s a first-pass estimate. Real systems vary with defrost, emitter sizing, controls, and wind or solar gains. Use it to plan, not to size equipment.
How do I turn kWh into running cost?
Multiply electricity kWh by your tariff. If you have time-of-use rates, apply the rate to the hours the heat pump runs.
Referral information and free credit offer
If you find the content of this website useful and are thinking of joining Octopus Energy, please consider using my referral code or ‘buy me a coffee’ to help support running costs of the website (hosting fees / cloud servers etc).
If you’re thinking of switching energy suppliers, homeowners that use this referral code can claim £50 of free Octopus Energy credit after sign-up: https://mickwall.octopus.energy
Business users that switch and sign-up using the same code with be granted £100 of free credit.
Get a £100 gift card when signing up for Solar or a Heat Pump installation through Octopus Energy using this link: https://tech.referrals.octopus.energy/ucMTeP8d
If you would like to ‘buy me a coffee’ to show support, please use this link: http://buymeacoffee.com/SVHgIbUYM
Energy Stats UK can be found on various social media platforms posting daily tariff pricing graphs and summaries.
Be sure to follow @energystatsuk on Twitter / X, Bluesky, Mastodon and Instagram.
Note: The current and past performance of energy pricing is not necessarily a guide to the future.

