
Introduction
The Vaillant aroTHERM weather curve – sometimes called a heating curve or weather compensation curve – is one of the most important settings on a Vaillant heat pump.
It controls how the system adjusts the target flow temperature of your radiators or underfloor heating depending on the outdoor temperature.
By fine-tuning the Vaillant heating curve (including the adaptive heat curve setting), you can improve comfort, reduce running costs, and get the best efficiency from your heat pump.
Note: this article (updated September 2025) forms part of a wider series of Vaillant Arotherm information and guides.
Vaillant Arotherm Heat Pump Guide: Weather Curve, Hot Water Modes, SensoCOMFORT, COP & SCOP
Vaillant aroTHERM Weather Curve Information
Understanding the weather compensation curve is essential to getting the best from a Vaillant aroTHERM heat pump. The diagrams in the manuals can look cryptic at first, but after three winters of running my own retrofit system with weather compensation, I’ve learned how to get the most out of these controls in practice.
In fact, my third winter write-up shows the performance gains I’ve achieved by running in weather comp mode: Third Winter with our Vaillant Heat Pump. That hands-on experience underpins everything I’m sharing in this guide — not just theory, but real-world results.
Why is my heat pump still heating when the target room temperature is exceeded?
As this is such a common question in Vaillant Arotherm forums I’m answering it specifically.
If you are used to a boiler, it can feel odd when a heat pump keeps running after the room temperature has gone past your target. A boiler is usually either on or off, but with weather compensation a heat pump works in a different way.
In Inactive and Active Room Temp Mod modes, the heat pump does not simply stop once the set temperature is reached. Instead it looks at the outside temperature and the inside temperature, and then picks a target flow temperature from the heating curve. That flow temperature is what drives how hot your radiators or underfloor are.
If the room is getting warmer than you want, the first thing to try is lowering the curve slightly. This will bring the flow temperature down and slow the heat going into the house.
The blunt alternative is to switch to Room Temp Mod: Expanded. In that mode the heat pump will switch off once the room hits the target temperature. It does work, but it is not the recommended way to run your system. With a properly set curve, Inactive or Active modes will keep your home steady and efficient.
It is also worth checking the OT Threshold. A sensible number here is around 16 °C, so the heat pump will switch off when the outside temperature goes above 16 °C and back on again when it drops below.
For a full explanation, see both of these guides:
You may also wish to read Heat Pump Performance for Normal People.
How Weather Compensation Works
At its core, weather compensation is simple: the colder it is outside, the hotter the water in your radiators or underfloor heating needs to be. The system automatically adjusts the flow temperature based on outdoor conditions.
-
Example: at –3 °C outside, you might need 45 °C flow.
-
At +10 °C outside, 30 °C flow could be enough.
A sensor on the north-facing wall measures the outside temperature and constantly updates the system. The goal is to match the heat loss of your home with the heat supplied by the heat pump.
The challenge is picking the right curve setting:
-
Too high (steep curve): rooms heat quickly but waste energy.
-
Too low (flat curve): rooms never quite reach the target temperature.
-
Just right (the “Goldilocks” curve): steady comfort with maximum efficiency.
Once dialled in, your heat pump can run “low and slow” — delivering just enough heat to keep the house stable. That’s how you get the best performance from any heat pump.
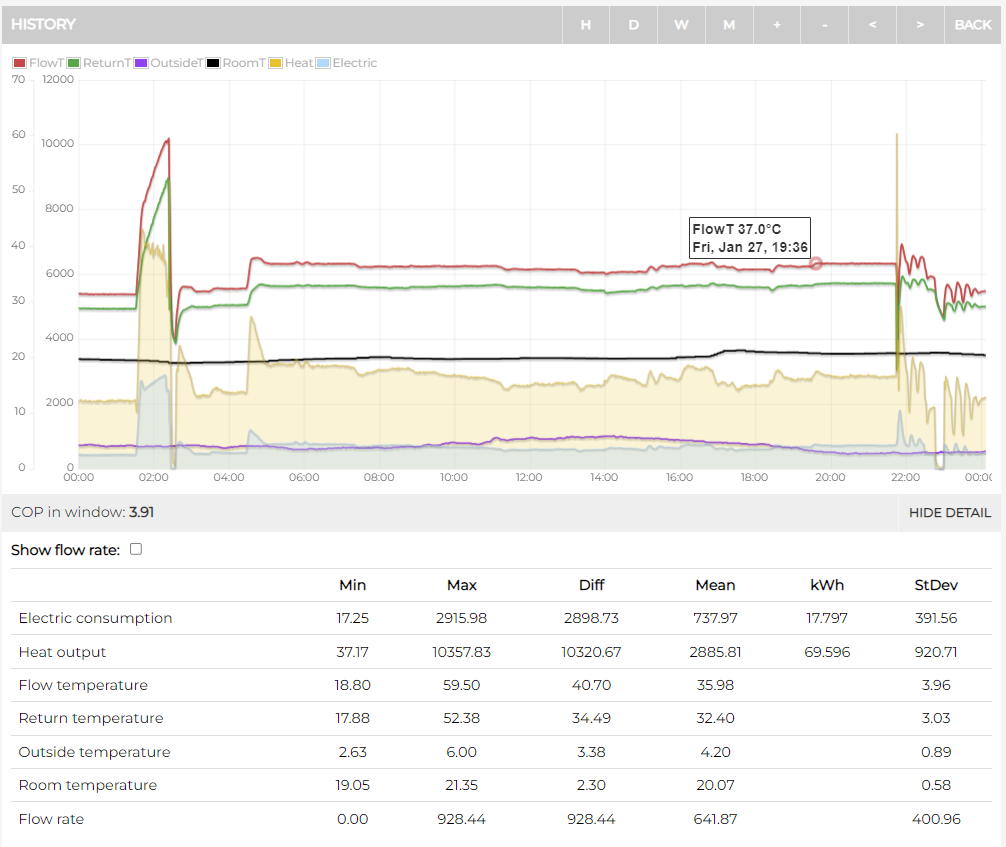
In my own system, a 20-hour run showed this balance in action: with outdoor temperatures between 2.8 °C and 5.8 °C, the flow only shifted subtly between 35 °C and 37 °C. The result? Continuous, efficient heating without short cycling.
Vaillant Diagrams from the Manuals
Vaillant includes several heating curve charts in its manuals, but they can look cryptic at first glance.
Here’s a clearer way to read and use them.
Choosing a Curve on the sensoCOMFORT Controller
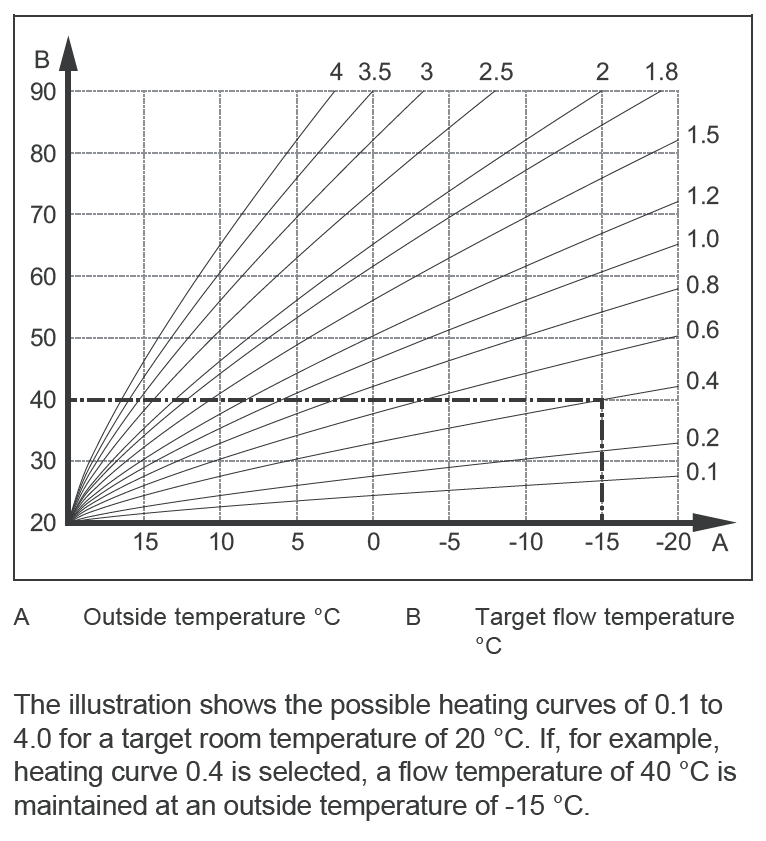
On the sensoCOMFORT controller, you can select a curve number in 0.05 increments. The manual shows curves from 0.1 to 4.0, but you can set in between values like 0.15, 0.25, 0.55, etc.
Menu path to check or change the heat curve:
-
Settings
-
Installer Level (default code: 00)
-
Installation Configuration
-
Circuit 1 → Heat Curve
A Note on Vaillant’s Documentation
The Vaillant diagram above suggests a 5 °C flow increase for a 1 °C indoor target rise. In practice, and from my own experience after three winters, the real shift is closer to 2.5 °C per 1 °C. It looks like a typo in the manual, and my logged data backs this up.
myVaillant App
Since October 2024, you can also adjust these settings directly in the myVaillant app:
-
Tap the cog icon
-
Go to Control Menu → Heat Curve Settings → Heating Curve (expert)
-
From there you can adjust:
-
Curve slope
-
Minimum flow temperature
-
Outdoor temperature switch-off threshold
-

The 20 °C Indoor Target Assumption
The first chart in the manual is based on an indoor target temperature of 20 °C only. If you adjust your room setpoint, the whole curve shifts up or down:
-
+0.5 °C indoors = +1.25 °C flow
-
+1.0 °C indoors = +2.5 °C flow
-
–1.0 °C indoors = –2.5 °C flow
So, raising your setpoint from 20 °C to 21 °C increases flow by 2.5 °C across the curve. Lowering to 19 °C drops it by 2.5 °C.


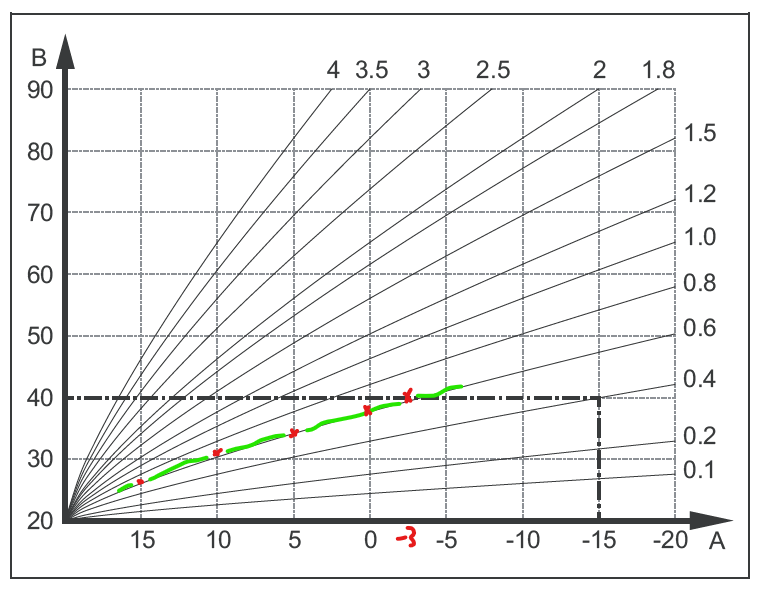
My Heat Curve Graph Scribblings
When I first looked at Vaillant’s heating curve chart, I found it tricky to see where the “real world” points would sit.
So I printed it out and scribbled on it by hand — filling in gaps the official graph doesn’t show.
For example:
-
Curves like 0.3, 0.45, 0.5, 0.55 aren’t labelled in the manual, but they matter for low-temperature installs.
-
A typical modern retrofit might run around 40 °C at –3 °C, which sits near curve 0.5.
-
In most homes, curves above 1.2 (≈ 54 °C at –3 °C) are rarely needed.
That personal testing gave me a clearer picture of where my system should sit.

Heat Curve Information in Tables
To make the graphs easier to use, I then built tables of flow temperatures for different indoor setpoints (18–22 °C), based on my scribbles.
Each table shows:
-
Room target temperature (yellow, top left)
-
Outdoor temperature points (blue, across the top)
-
Curve numbers (green, left-hand side)
-
Calculated flow temperatures (white cells)
👉 The key takeaway: every 1 °C change in your indoor target shifts the flow by ~2.5 °C.
I find this table format makes it much easier to match your design temperature (e.g. 40 °C flow at –3 °C outside, 20 °C indoors) to the right curve number.
18C° Indoor Target Temperature

18.5C° Indoor Target Temperature

19C° Indoor Target Temperature

19.5C° Indoor Target Temperature

20C° Indoor Target Temperature

20.5C° Indoor Target Temperature

21C° Indoor Target Temperature

21.5C° Indoor Target Temperature

22C° Indoor Target Temperature

How to Use the Heat Curve Tables
There are three practical ways to choose a starting curve for your Vaillant aroTHERM:
1. Use Your Design Temperatures
Every MCS-approved installation should come with a heat loss survey. This report gives you three key numbers:
-
Indoor target temperature (e.g. 20 °C)
-
Design outside temperature (DOT) for your location (e.g. –3 °C in much of England, colder in Scotland)
-
Target flow temperature at that DOT (e.g. 40 °C)
👉 Here’s how to use the table (as shown below)
-
Find your indoor setpoint (e.g. 20 °C) – top left in yellow.
-
Move across to your design outside temp column (e.g. –3 °C) – blue
-
Look down that column until you reach your target design flow temperature (e.g. 40 °C).
-
The row gives you your starting curve number (e.g. 0.6).
That curve will keep the system adjusting flow temperature automatically as the weather and outside temperature changes.

So going back to the graph, we can highlight those figures (40C at -3 for 20C indoors) to show how it looks on the graph if we chose curve 0.6 when 20C indoors.
Note: there is a bit of rounding up and rounding down of some of the figures in the tables I created to hit whole numbers. So just pick the closest to your design temperatures as a starting point.
Once you’ve tried this curve selection for a while and you get an idea whether you’re too hot or too cold you can turn things down or up as required.
2. The “Heat Geek” Method
Another approach is more hands-on:
-
Start with a conservative curve (say between 0.6 and 0.8)
-
On cold days, turn the curve down slightly each day.
-
When the house starts to feel a touch too cool, turn it back up one notch.
This trial-and-error method ignores design calcs and goes by comfort — but it works surprisingly well.
3. The Havenwise Method
Havenwise is a smart software platform that connects to the same Vaillant platform as the myVaillant app. It uses your home’s thermal profile, outdoor weather data, and energy tariff rates to automatically choose the right curve and adjust flow temperatures.
Key benefits:
-
Learns how your house responds, then optimises automatically.
-
Shifts heating to cheaper tariff periods (Agile, Cosy, etc.).
-
Adjusts curves more precisely than manual tweaking.
👉 In my experience, I’ve found that Havenwise does a better job at maintaining target indoor temperatures than the standard Vaillant controls — with less fiddling. It’s a good option if you want efficiency but don’t have time (or patience) to experiment with curves yourself.
Indoor Target Temperature Really Matters
Whichever method you use to set your curve — design calcs, trial-and-error, or Havenwise — the indoor target temperature you choose has a huge impact on performance.
Every 1 °C change in room setpoint shifts the flow temperature by around 2.5 °C across the whole curve. That adds up fast:
-
19 °C indoors → lower flow temps (better efficiency / COP).
-
21 °C indoors → higher flow temps (lower efficiency).
-
A 2 °C difference indoors can mean a 5 °C change in flow, with a noticeable effect on running costs.
Vaillant’s own technical literature shows the same thing: a 10 °C increase in flow temperature can significantly reduce SCOP (seasonal efficiency) across the year. In other words, every degree matters.

This is why two houses with identical heat pumps can report very different seasonal COP (SCOP) values — their chosen indoor setpoints drive the numbers.
In my own system, I’ve seen the real-world performance shift dramatically between 19 °C and 21 °C setpoints.
If you’re comparing data on heatpumpmonitor.org (part of Open Energy Monitor), always check the target room temperature before drawing conclusions.
👉 My own live system data is also available at emoncms.org/energystatsuk.
How does the Weather Curve work in Setback Mode
Setback mode on the Vaillant is a way of choosing a lower target indoor temperature at certain times of the day. Usually people choose a setback temperature overnight to provide comfort when sleeping.
For example
- Normal Target Temperature: 20C
- Overnight Setback Target Temperature: 19C
In setback, the curve mechanism works exactly the same.
Remember, the target flow temperature is always dictated by the combination of target room temperature, curve setting and outside temperature. It just picks a flow temperature off a predetermined list based off those 3 elements.
By running in setback, all you are doing is choosing targeting a lower indoor temperature. So the system just chooses a lower flow temperature.
This advice is for Normal setback mode. Vaillant also offers an Eco setback mode, which sounds similar but works in a completely different way.
ADVICE: I would suggest never having the setback more than 2C lower than your normal target temperature. This is because the heat pump is not aggressive enough with choosing flow temperatures (even in Active mode) So it can take a long time to get back to target temperature after coming out of setback.
Eco Setback Mode vs Normal Setback
Here’s what happens in each case:
-
Normal setback
-
The heating function stays on.
-
The controller regulates to the setback room temperature using the heating curve.
-
Flow temperature is still modulated smoothly based on outside temperature.
-
-
Eco setback (factory default)
-
The heating function is switched off, with only frost protection active.
-
The outdoor temperature is continuously monitored.
-
If the outdoor temperature stays below 4 °C for more than four hours, the system switches the heat pump on and regulates up to the setback room temperature.
-
If the outdoor temperature is above 4 °C, the heating function remains off completely.
-
Frost protection remains active at all times.
-
-
Eco setback with “Expanded” room temp mode
-
Normally, Eco ignores the curve entirely and only reacts to outdoor temperature.
-
If you enable “Expanded” in Menu → Control → Zone → Room temp. mode, the behaviour changes.
-
In that case, the system regulates to a fixed 5 °C room temperature during Eco, regardless of the outdoor temperature.
-
This is effectively a hard frost-protection mode that will always maintain at least 5 °C inside.
-
The key point: Eco setback breaks weather compensation and just turns into a form of frost-protection.
How to Change the Setback Mode
If your system is currently in Eco (the factory default), you can switch it:
-
On the SensoCOMFORT controller, go to:
Menu → Control → Zone → Heating → Mode -
You’ll see the Set-back mode option.
-
Change it from Eco to Normal.
-
Confirm and exit.
Now the controller will regulate to the setback temperature using the heating curve, instead of switching the heating off.
Room Controls
The Room Temp Mod setting on the sensoCOMFORT controller changes how much influence the room thermostat has over the flow temperature. It sits alongside the weather compensation curve and can affect how closely your system follows the graph.
You’ll find it in:
-
Settings
-
Installer Level (default code: 00)
-
Installation Configuration
-
Circuit 1 → Room Temp Mod
There are three options:
-
Inactive (Pure WC): The room stat is just a display. Flow temperature follows the weather curve exactly.
-
Active (WC + Room Influence): The system adjusts flow temperature a small amount depending on how far the room temp is from the indoor target.
-
Expanded (WC + Room Influence + On/Off): Adds full on/off switching if the room exceeds the target temperature.
Tip: Many people run Inactive for pure weather compensation, but depending on your home, Active or Expanded may give better comfort.
Personally, I’d choose Active setting every time to get that small amount of room influence. I would recommend staying clear of Expanded mode as it works more like an on/off system, which is not how heat pump need to run.
There’s no harm in experimenting though — just make sure your min and max flow temperatures are set correctly so they don’t override the curve.
For example: if you choose curve 0.6 at a 20 °C indoor target, you’ll want your:
-
Minimum flow at least 26 °C or lower (for 15 °C outside).
-
Maximum flow at least 40 °C or higher (for –3 °C outside).
Refer back to the tables over for minimum and maximum flow temperatures.
👉 I’ve written a separate deep dive into the sensoCOMFORT controller and the Room Temp Mod settings here: SensoCOMFORT Room Temp Mod: Inactive, Active or Expanded?

The Vaillant Adaptive Heat Curve
Vaillant offers an adaptive heat curve setting that’s supposed to adjust itself automatically. In theory, it learns how your home warms up and fine-tunes the flow temperature over time, so you don’t need to tweak the curve manually.
How to Enable or Disable Adaptive Heat Curve
On the sensoCOMFORT controller:
-
Go to Settings → Installer Level (access code 00 by default).
-
Open Installation Configuration → Installation → Adapt. heat curve.
-
Choose Activated or Deactivated.
As of now, this option isn’t available in the myVaillant app — you’ll need to set it directly on the controller.
My Real-World Experience
After three winters with a Vaillant aroTHERM, I can’t recommend using adaptive mode. In practice it rarely gets the flow temperature right, and often leaves the house cooler or less stable than a fixed curve.
If you want a genuine “set and forget” solution, you’ll get far better results from a smart optimiser like Havenwise, which uses weather forecasts, your home’s heat profile, and electricity tariff data to make intelligent adjustments.
👉 My advice: try Adaptive if you’re curious, but expect patchy results. For most homes, a fixed curve (or Havenwise) is a much better choice.
Conclusion – Getting the Best from the Vaillant Weather Curve
The Vaillant aroTHERM weather curve is one of the most powerful tools for balancing comfort, efficiency, and running costs. Once you understand how flow temperature shifts with outdoor conditions, you can tune the heating curve so your home stays warm without wasting energy.
There are different ways to set it — from following your design temperatures, to the Heat Geek method, to using smart optimisers like Havenwise.
Whichever route you take, remember:
-
Every degree of indoor target temperature matters (≈ 2.5 °C shift in flow per 1 °C indoors).
-
Keep your curve slope low enough for efficiency, but high enough for comfort.
-
Don’t forget to check your min/max flow settings so they don’t override the curve.
-
Avoid the adaptive heat curve — in my real-world use it hasn’t delivered good results.
- Try different Room Temp Mod settings, Active is recommended, Expanded it to be avoided.
After three winters with a Vaillant aroTHERM in my own retrofit system, my advice is:
👉 Initially choose the curve setting based the system design information, monitor how your home responds, and adjust gradually. The Heat Geek method is surprisingly effective.
Getting your heat pump to run low, slow and continuous is the key to steady comfort and the best seasonal performance from a heat pump.
Vaillant aroTHERM Weather Curve – FAQs
What is the Vaillant weather curve?
The Vaillant aroTHERM weather curve (also known as a heating curve) tells the heat pump what flow temperature to produce at different outdoor temperatures. A steeper curve means hotter water for colder days, while a flatter curve keeps flow temperatures lower.
What’s the difference between a heating curve and a weather compensation curve?
They are two names for the same principle. The heating curve or weather compensation curve automatically adjusts your heat pump’s output depending on the weather, so your home stays at a steady temperature without manual adjustments.
What is the best target flow temperature for a Vaillant heat pump?
There isn’t one fixed “best” flow temperature, because weather compensation adjusts it automatically. What matters is setting the heating curve correctly so that your home stays warm at the coldest design temperature. Aim for the lowest curve that still keeps rooms comfortable — lower curves usually mean better efficiency.
What is the Vaillant adaptive heat curve?
The adaptive heat curve is a setting you can find under Installation Configuration → Installation → Adapt. heat curve (Activated/Deactivated) on the sensoCOMFORT controller. In theory, it learns how your home responds and adjusts the heating curve automatically.
In practice, I don’t recommend it — after three winters with a Vaillant aroTHERM, I’ve found it delivers inconsistent results. If you want a true “set and forget” option, a smart optimiser like Havenwise works far better.
How does indoor target temperature affect flow temperature?
Every 1 °C change in your indoor setpoint shifts the flow temperature by about 2.5 °C across the whole curve. Lower indoor setpoints mean lower flow temps and better efficiency, while higher setpoints increase flow temps and reduce efficiency.
Why does SCOP vary so much between homes with the same heat pump?
Indoor set temperature makes a huge difference. Vaillant’s own data shows that a 10 °C rise in flow temperature can reduce SCOP noticeably. Two identical systems at 19 °C and 21 °C indoors may report very different seasonal performance.
What is Room Temp Mod on the Vaillant sensoCOMFORT?
Room Temp Mod sets how much the room thermostat influences flow temperature. Options are Inactive (pure weather comp), Active (adjusts flow if room is off target), and Expanded (adds on/off switching).
How should I set minimum and maximum flow temperatures?
Always set them beyond the limits of your chosen curve. For example, if you use curve 0.6 at 20 °C indoors, set the minimum at least 26 °C (for 15 °C outside) and the maximum at least 40 °C (for –3 °C outside).
What’s the easiest way to find the right heating curve?
You can start with your system’s design temperatures, use the “Heat Geek” method of turning the curve down until you feel cold, or let Havenwise optimise it automatically through the myVaillant app.
Referral information and free credit offer
If you find the content of this website useful and are thinking of joining Octopus Energy, please consider using my referral code or ‘buy me a coffee’ to help support running costs of the website (hosting fees / cloud servers etc).
If you’re thinking of switching energy suppliers, homeowners that use this referral code can claim £50 of free Octopus Energy credit after sign-up: https://mickwall.octopus.energy
Business users that switch and sign-up using the same code with be granted £100 of free credit.
Get a £100 gift card when signing up for Solar or a Heat Pump installation through Octopus Energy using this link: https://tech.referrals.octopus.energy/ucMTeP8d
If you would like to ‘buy me a coffee’ to show support, please use this link: http://buymeacoffee.com/SVHgIbUYM
Energy Stats UK can be found on various social media platforms posting daily tariff pricing graphs and summaries.
Be sure to follow @energystatsuk on Twitter / X, Bluesky, Mastodon and Instagram.
Note: The current and past performance of energy pricing is not necessarily a guide to the future.


3 Comments