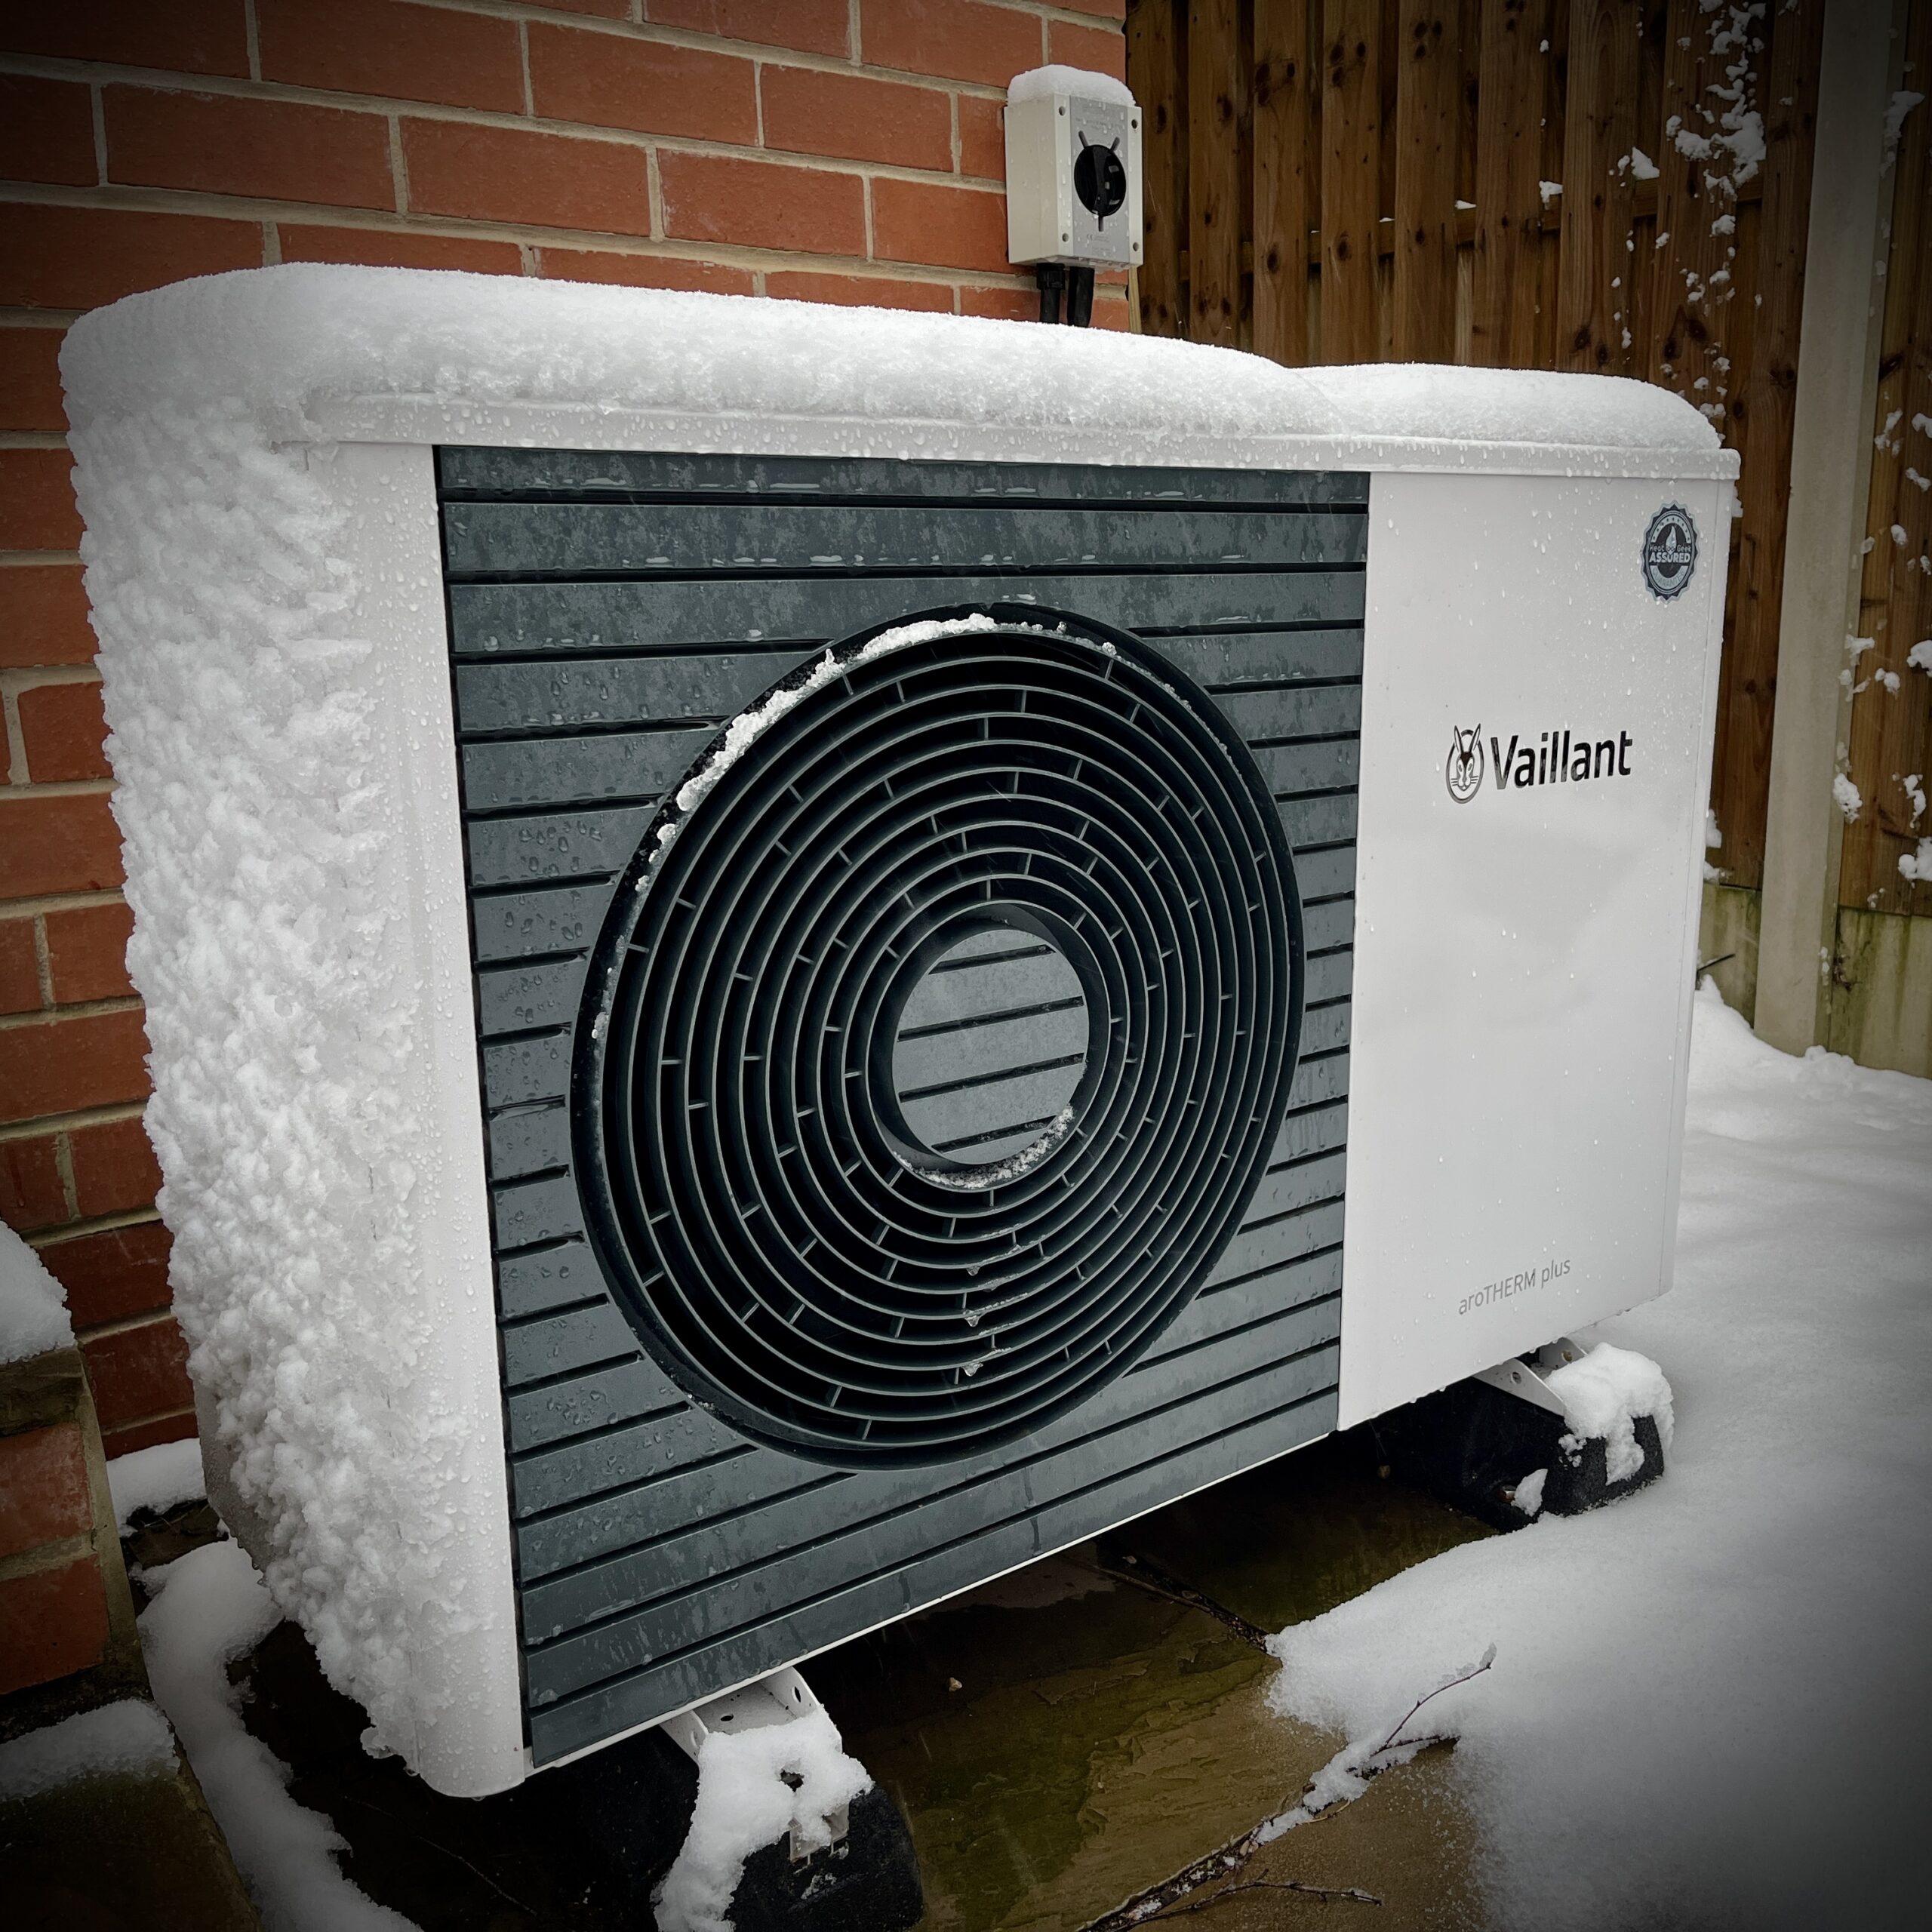
Second Winter With Our Vaillant ASHP
This post is a follow up to the original ‘first winter with my air source heat pump’ article.
This new article covers the same November to April time period as the first article. I.e. the ‘heating season’.
I hope that this second edition, in conjunction with the first one, can provide a variety of information, stats, hints, tips and lessons learnt.
Headline Performance News
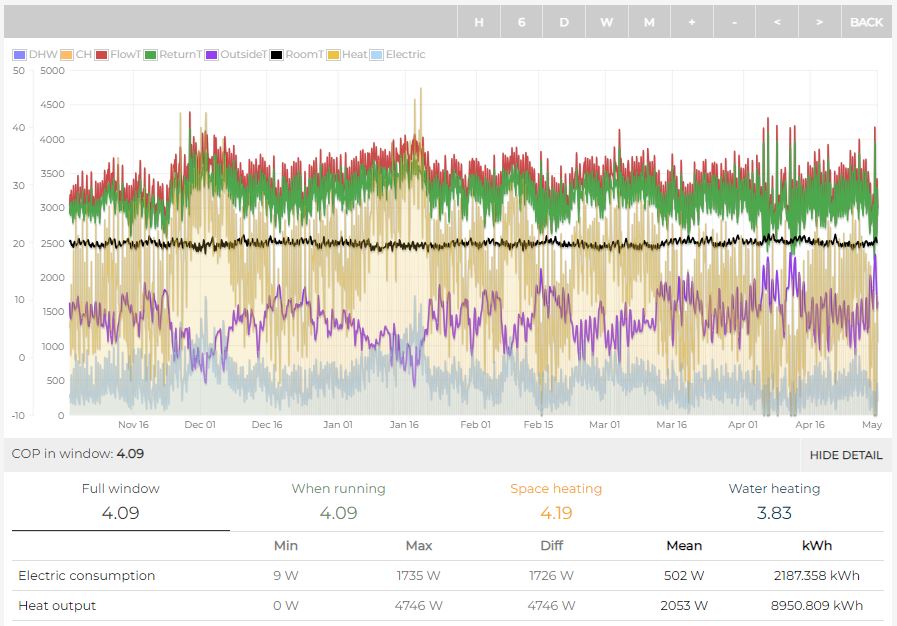
Electricity Used and Heat Output (kWh)
- Electric Used: 2187 kWh
- Heat Output: 8950 kWh
SCOP across 6 months (November 2023 to end April 2024)
- Total : 4.09 (up from 3.67 in the first winter)
- Heating Only: 4.19
- Hot Water only: 3.83
Demand Split
- Heating (73%)
- Hot Water (27%)
All performance information provided via the amazing Open Energy Monitor platform.
You can view all my daily performance going back to November 2022 here: https://emoncms.org/energystatsuk
And find my heat pump alongside many others on https://heatpumpmonitor.org/
House Summary
- 1930 semi detached 3 bedroom house in Sheffield
- 90sqm, 2 adults, 2 kids
- EPC D rated (prior to solar installation in 2018)
- 5.1kW solar, 16kWh battery storage
- 5kW Vaillant Arotherm Plus heat pump
- 250L Mixergy water cylinder
Find more details about the heat pump installation here:
My 5kW Vaillant Arotherm Heat Pump
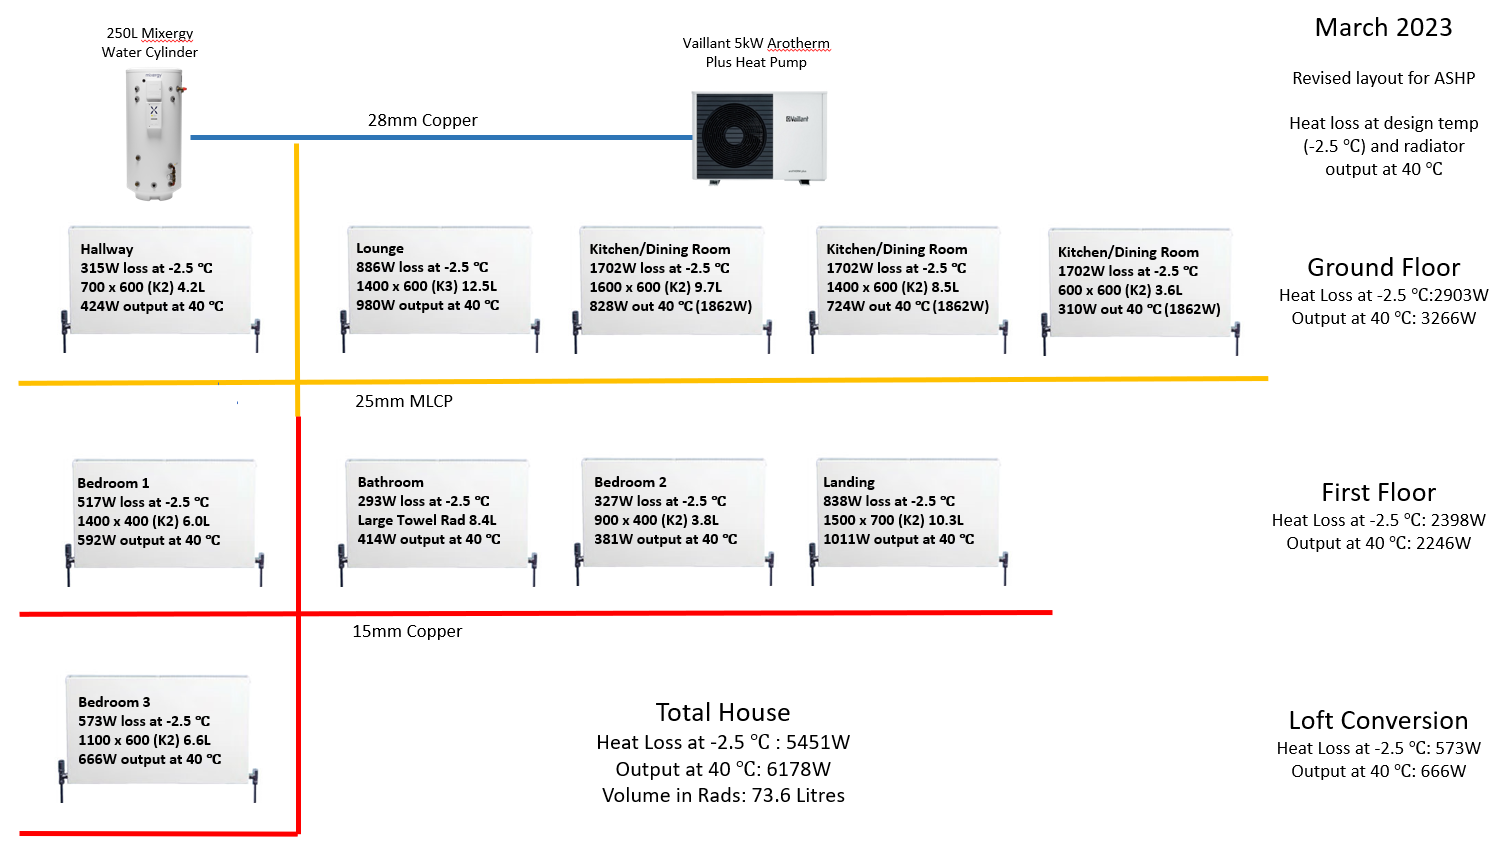
Additional Radiators for 2023/24
I made reference to the new radiator plan in the review of my first winter with the heat pump.
In summary, in bedroom 2 I had left the original single panel in there when we first put the heat pump in, but decided to upgrade to a double panel ahead of this winter as the room sometimes didn’t get up to temp.
And in the dining room I added another small radiator as that room is my worst room. What Heat Geek calls the reference room. It is a single storey extension on the north side of the house. So it’s exposed to the elements on all sides.
This is what the new radiator layout looked like heading in the the second winter.
How did the new radiators perform?
The bedroom radiator did the trick. Although some of the new heat also came from us turning the lads bedroom into his new gaming room. So he’s spending way more time in there.
Human bodies and switched on gaming consoles create their own heat.
The dining room still struggles a little. It doesn’t struggle to maintain heat once at temperature. But it can take a long time to get out of setback. This room is the one that drops the quickest and lowest when it hits sub zero.
So you would tackle this shortfall in one of two ways
- Add more heat output (more rads or increase flow temperature)
- Increase the insulation / air- tightness
I can’t increase the flow temperature of the whole system as that would throw the rest of the house out.
I’ve already put about as much radiator on the dining rooms as possible, so that’s not really an option.
There is potential to put another rad in the adjacent open plan kitchen that could take some of the load off the dining room. So something to explore.
The final solution is to look at increasing insulation and air tightness.
There is definite scope to look at this as I know for a fact that the suspended floor under the extension is poorly insulated and draughty.
The bottom line is that comfort levels in the house are fantastic. The comfort that comes from steady state heating is on a whole different level to the on / off we had with previous the gas boiler.
Heating Control Strategy
Once your control strategy is in place with a heat pump you just don’t touch the controls as the weather compensation sorts everything out for you.
Weekends
- 04:30 – 21:00 Heating Target 20C
- 21:00 – 04:30 Setback Target 19C
Weekdays
- 04:30 – 08:00 Heating Target 20C
- 08:00 – 14:00 Setback Target 19C
- 14:00 – 21:00 Heating Target 20C
- 21:00 – 04:30 Setback Target 19C
As we are a family that are mainly at work or school in the day during the week it makes sense to drop back to setback during the day and warm the house up in the afternoon for when we all get home.
On the occasions when we work from home or have a day off midweek, I manually adjust the thermostat to 20C about 8am to maintain 20C as required.
This control strategy works really well for us.
On the Vaillant Sensocomfort thermostat I have that in “Room Influence Mode (active)’. Rather than sticking rigidly to the weather curve it takes into account the temperature of the room and subtly adjusts the flow temperature of the water into the radiators to reach or maintain room temperature.
You can read about weather compensation curve and thermostat modes here:
After a little bit of tinkering I ended up sticking with 0.5 on the weather compensation curve. This gets me 38C flow at -3C outside for target 20C indoors, which seems to work well in conjunction with ‘active’ room influence.
Dropping from 20.5C to 20C room temperature target
In the first winter I think I was a bit apprehensive about the house being at a comfortable temperature hearing all the horror stories about heat pumps. So we erred on the side of caution and targeted 20.5C internal temperature.
There was no need to be worried and at times last winter it was actually too warm.
So for this winter I dropped the target from 20.5C to 20C.
It has been fantastic. The steady state, low temperature from the radiators is so comfortable.
Hot Water Strategy
For hot water I have two main runs per day; 1am and 1pm
This winter I have been taking my 250L Mixergy to 100% full with a target temperature of 48C on both runs.
I stopped using multiple ‘top ups’ through the day as you get much better hot water performance by doing longer hot water runs starting from an emptier state.
I did a massive deep dive on the performance of my Mixergy Cylinder (and heat pump hot water runs in general) in this article.
I will go into hot water performance across the whole winter later in the article with a lovely graph.
But suffice to say, big improvement from the first winter by using Eco mode on the Vaillant and targeting a lower water temperature.
In the summer I am going to see if I can drop the target temperature to 45C in conjunction with the new Heat Geek Mixergy settings in the app.
https://www.mixergy.co.uk/blog/mixergy-and-heat-geek-integration/
I wrote an article here about how increasing or dropping your target cylinder temperature gives you more or less usable water from your tank.
Don’t close down rads chasing DT5
Early in the winter I became obsessed with ensuring there was a 5 degree difference between the flow and return pipes across each radiator in the house.
I’d used temperature probes on both pipes and started adjusting the lockshield to achieve this. It was very hard to achieve on my Vaillant. It seemed almost impossible at times.
This is because the Arotherm heat pump (and some others do) used a fixed flow rate so it has to adjust the DT (difference between flow and return temperatures) to modulate the heat output. So it only ever reaches DT5 when it is outputting close to maximum output, ie 5kW with my model. For most of the year, 7C etc, it is only around DT3 etc.
By turning down the lockshield was I squeezing the life out of the available system volume. Ie, the amount of water actively running from the heat pump and around the radiators.
By tightening the lockshields so much I was not allowing much water to flow at all. The water was effectively only flying around the pipework and not much into the radiators.
The outcome of this was that my heat pump cycled way more than it should have. Ie, it stopped and restarted more than it should.
It was only when I started to open up the lockshields again that the on periods started to be longer and I saw efficiency improve too.
So don’t get obsessed with chasing DT5 across the rads.
With radiators it feels like you need to find the sweet spot where most of them are as open as much as possible, but closed just enough so that there is enough resistance so that water reaches every radiator.
No pun intended, but it’s a balancing act!!
Just use the lockshield to make minor changes up or down to the output to tweak room temperatures as required.
Additional note: I have found it best to balance the radiators on very cold days, ie when close to design outdoor temperatures (DOT) i.e. around zero C and below.
You have more chance that your heat pump will be running really long runs, so you won’t be waiting for periods in-between cycles and radiators temps potentially dropping off. It should be just running all the time.
There is also more chance that you’ll see DT5 across the radiators when close to DOT, especially on Arotherm heat pumps or any heat pump that uses a fixed flow rate and use the DT to modulate the heat output.
Stop zoning/closing rads – goodbye Tado
In my ‘first winter’ article I proudly boasted that I was still using some smart TRV controls to close down bedrooms in the early evening.
These Tado TRV were a remnant from my gas boiler days that I was still making use of.
But after a full winter I can tell you, you don’t need them.
With a correctly setup weather compensation system you don’t get rooms overheating.
And by setting your overnight setback to kick in at a sensible time each night, in my case 9pm, the bedrooms start to naturally cool by themselves without the need to close off individual radiators.
The massive downside to using TRV to shut off radiators is that you remove a chunk of working and available system volume (water in the radiators) from the heat pump. Similar to the ‘chasing DT5’ problem mentioned earlier.
You can see this in the monitoring. The heat pump can be working merrily and then boom, it just stops and cycles. The restart costs efficiency and then running without the radiators (and system volume) in play continues to cost efficiency.
Much better to run the system fully open at a lower flow temperature.
Smart TRV experiment over – don’t do it!!
So much so, I put all my Tado TRV onto eBAY.
Coldest Day of the Winter – 18th January 2024
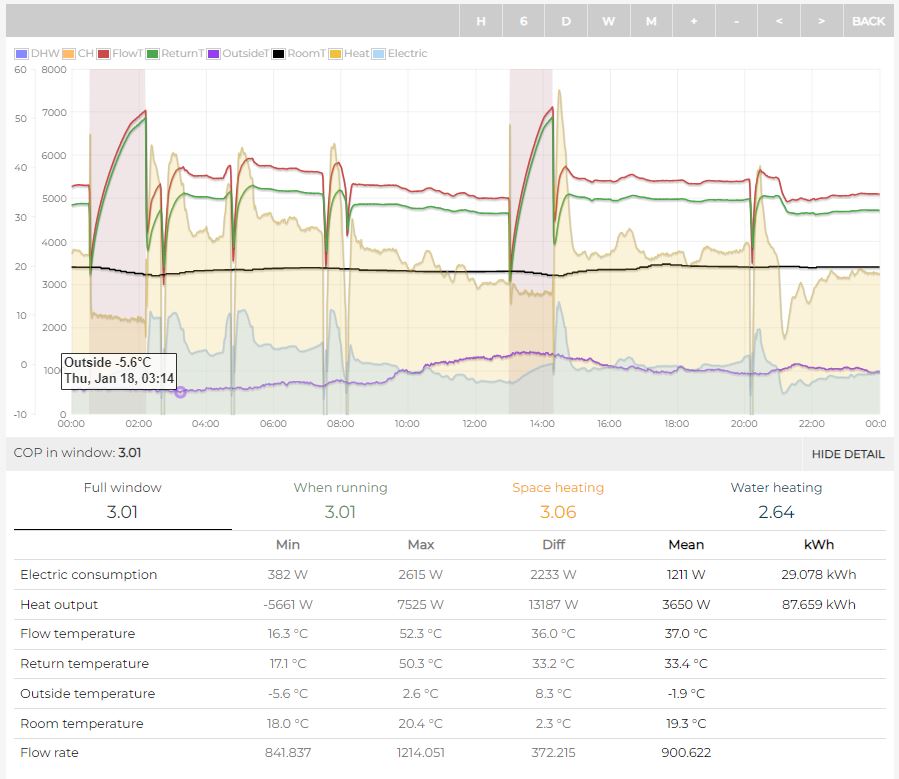
It dropped to a low of -5.6C overnight with a max of 2.6C in the day.
- Electrical input: 29.1 kWh
- Heat Output: 87.7 kWh
- COP: 3.01
You can look at that day via this link:
https://emoncms.org/energystatsuk?mode=power&start=1705536000&end=1705622400
Pretty happy that even on the very coldest day of the year we still only need 40C flow temperature water running through the radiators. This is why performance has been so good. The lower the flow temperature you can design the system for, even on the coldest days, you can drive the best performance.
Month by Month Comparisons
These are taken directly from my dedicated heat pump performance history post
Heat Pump Performance History
November
| Month / Year | Electric Input kWh | Heat Output kWh | COP | Outside Low | Outside Avg | Outside High | Avg Room | Heating % | DHW % |
| Nov-2022 | 344 | 1356 | 3.94 | 2.1 | 8.8 | 15.2 | 20.2 | ||
| Nov-2023 | 347 | 1366 | 3.94 | -2.5 | 6.5 | 13.3 | 19.8 | 87 | 17 |
December
| Month / Year | Electric Input kWh | Heat Output kWh | COP | Outside Low | Outside Avg | Outside High | Avg Room | Heating % | DHW % |
| Dec-2022 | 647 | 2195 | 3.39 | -3 | 4.3 | 12.1 | 20.3 | ||
| Dec-2023 | 414 | 1704 | 4.12 | -4.7C | 6 | 12.7 | 19.9 | 78 | 22 |
January
| Month / Year | Electric Input kWh | Heat Output kWh | COP | Outside Low | Outside Avg | Outside High | Avg Room | Heating % | DHW % |
| Jan-2023 | 569 | 2056 | 3.61 | -3.2 | 4.9 | 11.1 | 20.3 | ||
| Jan-2024 | 503 | 1956 | 3.89 | -5.3 | 4.3 | 13.1 | 19.6 | 81 | 19 |
February
| Month / Year | Electric Input kWh | Heat Output kWh | COP | Outside Low | Outside Avg | Outside High | Avg Room | Heating % | DHW % |
| Feb-2023 | 390 | 1471 | 3.77 | -1.6 | 6.6 | 14.1 | 20.5 | ||
| Feb-2024 | 332 | 1409 | 4.24 | -0.8 | 7.1 | 15.7 | 19.7 | 78 | 22 |
March
| Month / Year | Electric Input kWh | Heat Output kWh | COP | Outside Low | Outside Avg | Outside High | Avg Room | Heating % | DHW % |
| Mar-2023 | 393 | 1433 | 3.64 | -3.9 | 6.3 | 15.5 | 20.0 | ||
| Mar-2024 | 318 | 1380 | 4.34 | -1.1 | 7.3 | 14.9 | 19.9 | 76 | 24 |
April
| Month / Year | Electric Input kWh | Heat Output kWh | COP | Outside Low | Outside Avg | Outside High | Avg Room | Heating % | DHW % |
| Apr-2023 | 205 | 848 | 4.13 | -1.4 | 8.4 | 17 | 19.6 | ||
| Apr-2024 | 238 | 1011 | 4.25 | 0.3 | 9.2 | 18.9 | 20.1 | 69 | 31 |
2022/2023 versus 2023/2024
Winter 2022/2023
| Month / Year | Electric Input kWh | Heat Output kWh | COP | Outside Low | Outside Avg | Outside High | Avg Room |
| Nov-2022 | 344 | 1356 | 3.94 | 2.1 | 8.8 | 15.2 | 20.2 |
| Dec-2022 | 647 | 2195 | 3.39 | -3 | 4.3 | 12.1 | 20.3 |
| Jan-2023 | 569 | 2056 | 3.61 | -3.2 | 4.9 | 11.1 | 20.3 |
| Feb-2023 | 390 | 1471 | 3.77 | -1.6 | 6.6 | 14.1 | 20.5 |
| Mar-2023 | 393 | 1433 | 3.64 | -3.9 | 6.3 | 15.5 | 20.0 |
| Apr-2023 | 205 | 848 | 4.13 | -1.4 | 8.4 | 17 | 19.6 |
| Winter 2022-2023 | 2548 | 9359 | 3.67 | -1.8 | 6.6 | 14.2 | 20.2 |
Winter 2023/2024
| Month / Year | Electric Input kWh | Heat Output kWh | COP | Outside Low | Outside Avg | Outside High | Avg Room |
| Nov-2023 | 347 | 1366 | 3.94 | -2.5 | 6.5 | 13.3 | 19.8 |
| Dec-2023 | 414 | 1704 | 4.12 | -4.7 | 6 | 12.7 | 19.9 |
| Jan-2024 | 503 | 1956 | 3.89 | -5.3 | 4.3 | 13.1 | 19.6 |
| Feb-2024 | 332 | 1409 | 4.24 | -0.8 | 7.1 | 15.7 | 19.7 |
| Mar-2024 | 318 | 1380 | 4.34 | -1.1 | 7.3 | 14.9 | 19.9 |
| Apr-2024 | 238 | 1011 | 4.25 | 0.3 | 9.2 | 18.9 | 20.1 |
| Winter 2023-2024 | 2152 | 8826 | 4.10 | -2.4 | 6.7 | 14.8 | 19.8 |
Both winter totals
| Month / Year | Electric Input kWh | Heat Output kWh | COP | Outside Low | Outside Avg | Outside High | Avg Room |
| Winter 2022-2023 | 2548 | 9359 | 3.67 | -1.8 | 6.6 | 14.2 | 20.2 |
| Winter 2023-2024 | 2152 | 8826 | 4.10 | -2.4 | 6.7 | 14.8 | 19.8 |
Running Costs
For the majority of winter 23/24 the price cap for gas and electricity was:
- Gas: 6.89p
- Electricity: 27.35p
I wrote a whole article on how heat pump COP / SCOP in conjunction with electric unit price are used to determine running costs for a heat pump.
With me having an EV, Batteries and Solar I have been able to reduce my average unit cost paid each month.
I am able to load shift a lot of usage into cheaper (and greener) overnight periods of the Intelligent Go tariff. EV charging, battery top ups and hot water runs for example. So big ticket items. This drives down average monthly import unit rates.
Here is a breakdown of my average unit cost each month through the winter.
- November: 11.93p
- December: 12.04p
- January: 12.47p
- February: 10.68p
- March: 9.97p
- April: 8.18p
When it gets colder the heat pump uses more electricity, which is pretty obvious.
Electricity used by heat pump each month
- November: 346 kWh
- December 414 kWh
- January: 512 kWh
- February 330 kWh
- March 339 kWh
- April 241 kWh
And the amount of solar we generate changes each month, with lowest amounts in December and January.
Solar Generation
- November: 139 kWh
- December 67 kWh
- January: 114 kWh
- February 145 kWh
- March 263 kWh
- April 388 kWh
Note: I have monthly stats going back to 2018 for our solar generation if you are interested
Here are some tables of costs based on the monthly breakdown of figures above.
Cost with Batteries, EV and Time of Use Tariffs (excluding solar contribution)
|
Electric Used by Heat Pump kWh
|
Unit Cost (p) | Monthly Cost | |
| November | 346 | 11.93 | £41.28 |
| December | 414 | 12.04 | £49.85 |
| January | 512 | 12.47 | £63.85 |
| February | 330 | 10.68 | £35.24 |
| March | 339 | 9.97 | £33.80 |
| April | 241 | 8.18 | £19.71 |
| Total | 2182 | Total | £243.73 |
Cost with Batteries, EV and Time of Use Tariffs (solar contribution removed from used total)
|
Electric Used by Heat Pump kWh
|
Solar Gen kWh | Electric Remain kWh | Unit Cost (p) | Monthly Cost | |
| November | 346 | 139 | 207 | 11.93 | £24.70 |
| December | 414 | 67 | 347 | 12.04 | £41.78 |
| January | 512 | 114 | 398 | 12.47 | £49.63 |
| February | 330 | 145 | 185 | 10.68 | £19.76 |
| March | 339 | 263 | 76 | 9.97 | £7.58 |
| April | 241 | 388 | 0 | 8.18 | £0.00 |
| Total | 2182 | 1116 | Total | £143.44 |
Cost at 27.35p Electricity Price Cap
| Electric Used kWh | Unit Cost (p) | Monthly Cost | |
| November | 346 | 27.35 | £94.63 |
| December | 414 | 27.35 | £113.23 |
| January | 512 | 27.35 | £140.03 |
| February | 330 | 27.35 | £90.26 |
| March | 339 | 27.35 | £92.72 |
| April | 241 | 27.35 | £65.91 |
| Total | 2182 | Total | £596.78 |
Cost of Heat required on an 85% efficient gas boiler
So the house needed 8,950 kWh of heat across the 6 months for both heating and hot water.
At a COP of 4.09 that meant we need 2,187 kWh of electricity to generate that heat.
To create 8,950 kWh of heat we would need to buy 10,530 kWh of gas.
10530 kWh gas x 85% efficiency = 8,950 kWh of heat.
10,530 kWh gas x 6.89p = £725.51
6 Month Running Cost Summary (based on my 409% efficiency at heat / water demands)
- Batteries / EV / Time of Use (With Solar): £143.44
- Batteries / EV / Time of Use (No Solar) : £243.73
- Cost at Octopus Electricity Tracker (avg 18p) £392.76
- Cost at Electricity Price Cap (27.35p): £596.78
- 85% Efficient Gas Combi Boiler at Octopus Gas Tracker (avg 4.3p): £452.79
- 85% Efficient Gas Combi Boiler at Gas Price Cap (6.89p): £725.51
Note: all prices above exclude standing charges on both fuels. Obviously, if you ditched gas (like I have), you wouldn’t have to pay the £100/year gas standing charge.
Plus, the costs listed exclude my Ripple Wind / Solar Farm Investments and also the £20 I managed to earn in solar exports across February, March and April.
You can see Octopus Tracker pricing for both Electricity and Gas here:
Octopus Tracker Yorkshire
Performance Charts
Here are few hand cranked performance charts using data pulled from my Open Energy Monitor Platform.
Hope you find some of these useful.
Remember, you can grab my hour by hour and day by day running stats here: https://emoncms.org/energystatsuk
And grab a whole host of graphs and comparison charts with other heat pumps over on https://heatpumpmonitor.org/
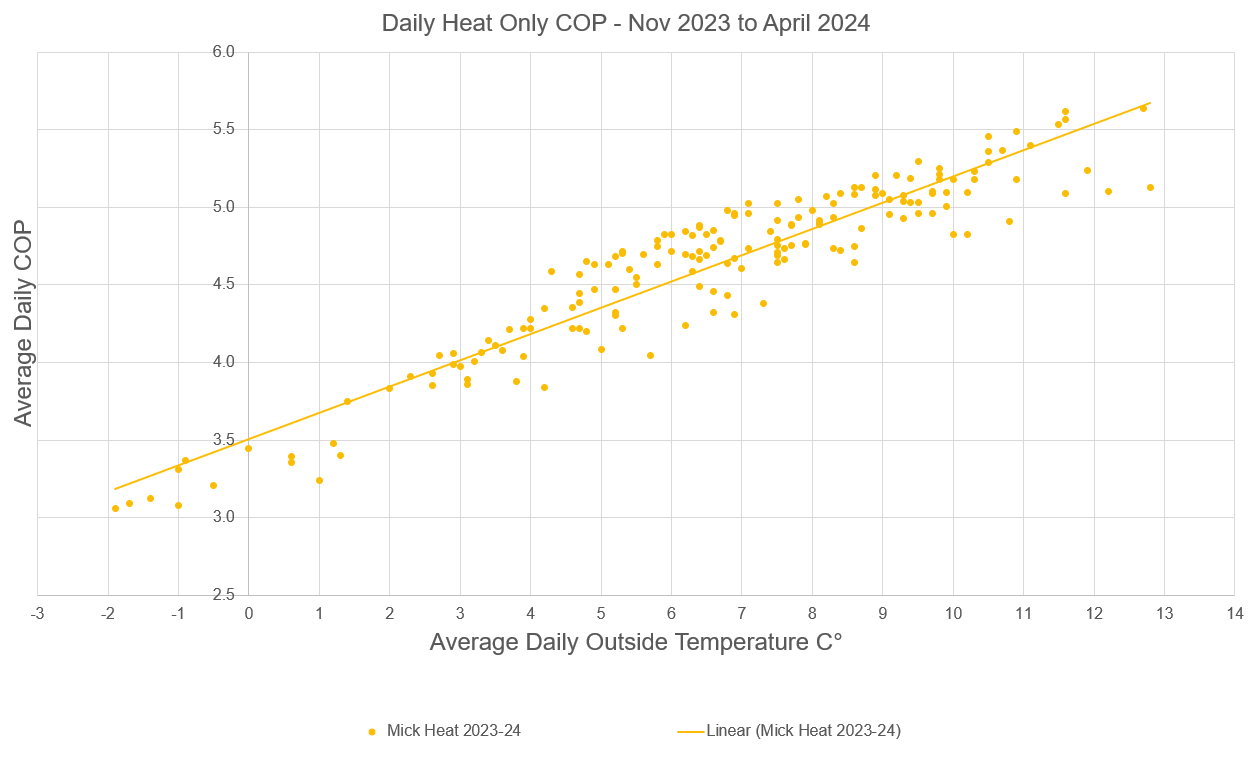
Daily Heat Only COP – Nov 2023 to April 2024
This one shows the average heat only COP for the day based on the average daily outside temperature recorded.
We did have one hour lows of -5.5C at some stage. But as you can see from the graph, the coldest average across a 24 hour period was just above -2C when we achieved a heat only COP of over 3. Which is really good.
Daily Hot Water Only COP – Dec 2023 to April 2024
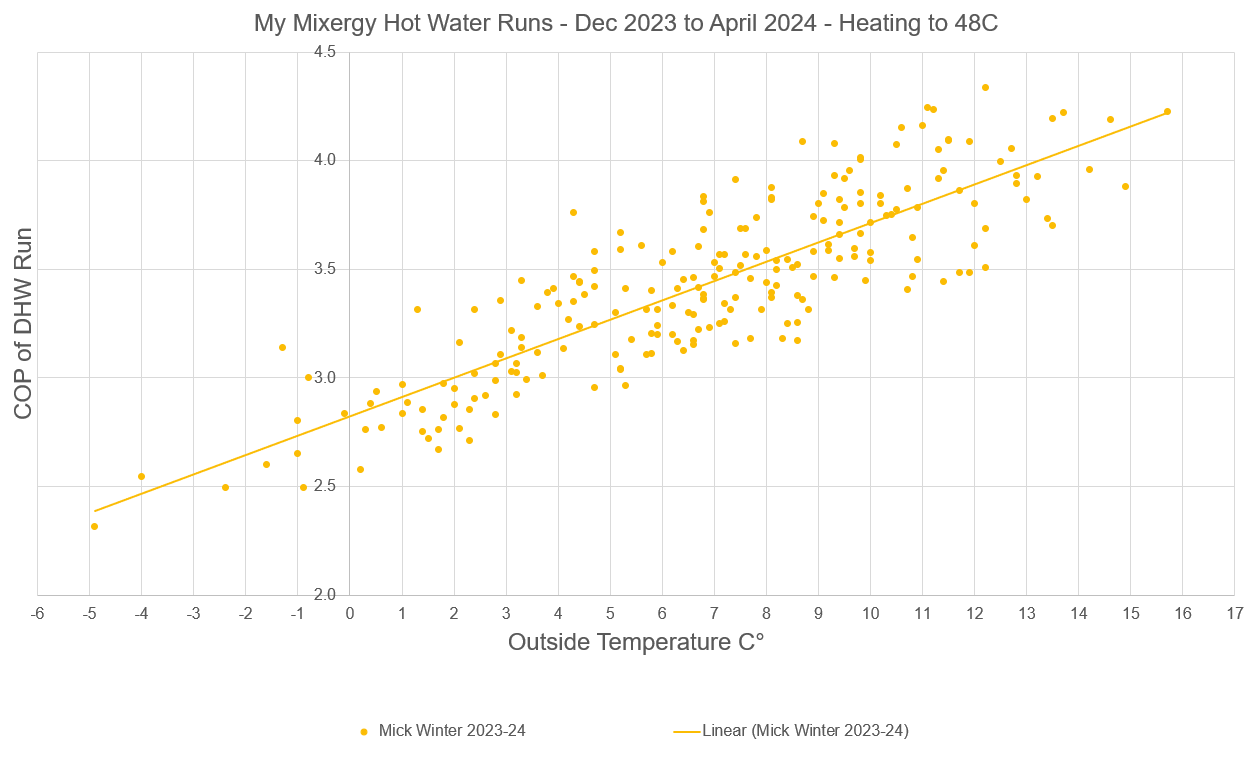
This one shows the COP achieved for each hot water run through the water via our Mixergy cylinder against the outside temperature when the hot water run happened.
We settled on heating the water 48C throughout the winter.
Obviously, the warmer it was outside, the better the efficiency.
This is why the advice is to move your big hot water run to 2pm each day as it’s usually the warmest part of the day.
Coldest hot water run of the winter was at -4.9C outside when we achieved a COP of 2.3 heating the water to 48C.
You can see the how the trendline rises as the outside temperature increases. Giving us hope for some great summer hot water COP figures.
Note: these charts only run December to April as I only started running Eco mode at the beginning on December, so seemed only fair to miss November (and not skew the whole graph).
Electricity Used and Heat Output based on average daily outside temperature
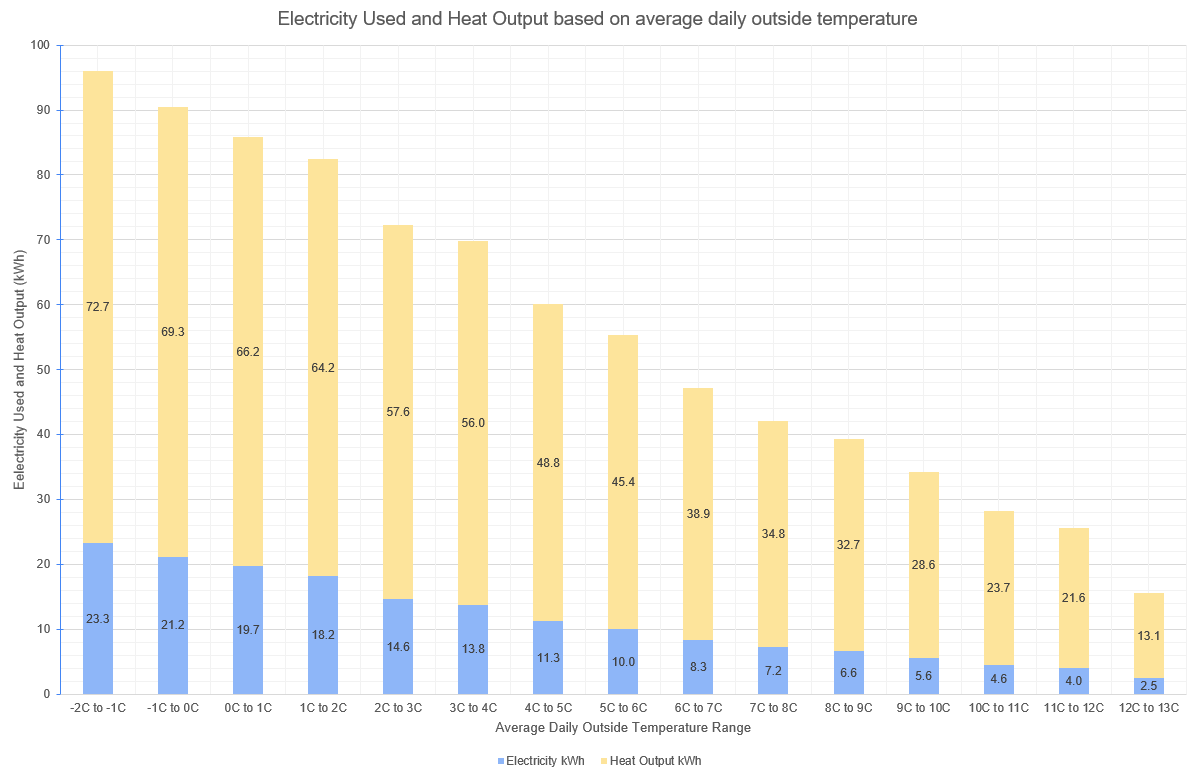
This one shows a direct correlation between outside temperature and the amount of heat the house needed to maintain 20C indoors.
You can see some major points here:
- The heat demand rises as the temperature drops (of course!).
- The amount of electricity required increases as the temperature drops.
- The COP drops as the temperature drops. 72.7 / 23.3 = 3.12 COP at the very cold end versus 13.1 / 2.5 = 5.24 COP at the warmer end.
Remember, this is for my 5KW heat pump with a calculated heat loss of 5.2kW and a measured heat loss of 4.3kW using the heat meter.
So you might be able to use this figures and pro-rata your own electricity usage and heat output.
Obviously, you’ll need to take into account my COP/SCOP achieved over this winter; 4.09 (combined), 4.19 (heat) and 3.83 (hot water).
One final point is regarding battery contribution.
As mentioned earlier in the article I have 16 kWh of battery. But as you can see from the graph above there are days when the heat pump needs more electric than I can store in the batteries. You have to make peace with this.
Unless you’ve got very deep pockets or live in a passivhaus with a tiny heat loss you are not going to be able to cover all your heat pump usage using batteries.
Remember, mine is only a 5kW heat pump and measured 4.2kW heat loss at -3C outside. If you have double the heat loss, say 8kW, you will need double the electricity each day, so perhaps close to 50 kWh just for heating.
The graph does not include hot water and it does not include other electricity needed for the rest of the house.
But don’t be disheartened. Batteries can make a big difference as not every day in a UK winter is 0C all day. When it’s 6C outside my heat pump only needs 8 kWh for heating. Plus there could be solar contribution that day. And you don’t need to be discharging the batteries during the cheap period of the tariff. So the longer the cheap period, the less time you need to cover with the batteries.
You may also want to consider a smart tariff where you can ‘double dip’ like Cosy or Agile. Charge the batteries and do the hot water runs twice in one day, making the most of the cheaper slots.
Attempt to get your overall average unit price down that way, by putting the ‘smart’ into smart tariffs.
Finally, you have to be careful going ‘too big’ on batteries to cover a small proportion of the winter as you can be left with more storage than you know what to do with for much of the year.
Summary and Round Up
All in all, still very happy with our heat pump.
It’s performing brilliantly and with a few system tweaks from the first year it is performing even more efficiently than the first winter.
- First Winter SCOP 3.67
- Second Winter SCOP 4.09
Likely a combination of using Eco mode for hot water, dropping the indoor target temperature to 20C (from 20.5C) and the radiator upgrades.
The outdoor unit is still super quiet, you can barely hear it.
The solar and batteries combine with the heat pump to make “The Holy Trinity” and are topped off with time of use tariffs.
Comfort in the house is off the charts. No messing with the thermostat. It’s just a constant lovely internal temperature.
What have I learnt this year?
Don’t zone. No messing about with anything ‘smart’ attached to your heat pump. Just have every radiator ‘open’ as you can and just let the weather compensation functions of the manufacturers controls do all the work for you.
Open Energy Monitor continues to bring so much detail to the party. Just this past month we have been looking into a bug in early Arotherm models that we detailed here.
Vaillant Arotherm Firmware 351.06.07 Problems (Energy Integral)
We would not have been able to dive this deep with OEM installed.
If you can afford an Open Energy Monitor system when you have your heat pump installed, I would highly recommend it.
What’s next?
Well I’m thinking of addressing the suspended floor insulation in the dining room extension this summer, so that might help with that room.
I’m currently playing with 45C target on the hot water through the summer. So combined with Eco mode I’m looking forward to some really nice COP when we get to those 20C and above days.
Apart from that, I think it’s steady as she goes.
Hope you’ve found this article useful.
Referral information and free credit offer
If you find the content of this website useful and are thinking of joining Octopus Energy, please consider using my referral code or ‘buy me a coffee’ to help support running costs of the website (hosting fees / cloud servers etc).
If you’re thinking of switching energy suppliers, homeowners that use this referral code can claim £50 of free Octopus Energy credit after sign-up: https://mickwall.octopus.energy
Business users that switch and sign-up using the same code with be granted £100 of free credit.
Get a £100 gift card when signing up for Solar or a Heat Pump installation through Octopus Energy using this link: https://tech.referrals.octopus.energy/ucMTeP8d
If you would like to ‘buy me a coffee’ to show support, please use this link: http://buymeacoffee.com/SVHgIbUYM
Energy Stats UK can be found on various social media platforms posting daily tariff pricing graphs and summaries.
Be sure to follow @energystatsuk on Twitter / X, Bluesky, Mastodon and Instagram.
Note: The current and past performance of energy pricing is not necessarily a guide to the future.
