How are the daily graph colours decided?
Below is a brief history of how the daily graph tweet has evolved. I’ve left everything in, in chronological order so that you can see progressions and why decisions were taken.
Early Days
Since the first ever daily tweet from the @energystatsuk Twitter account in November 2019 there have been a few changes to the look and feel of the graph.


The August 2020 code change was where I first added colours that are based on unit price.
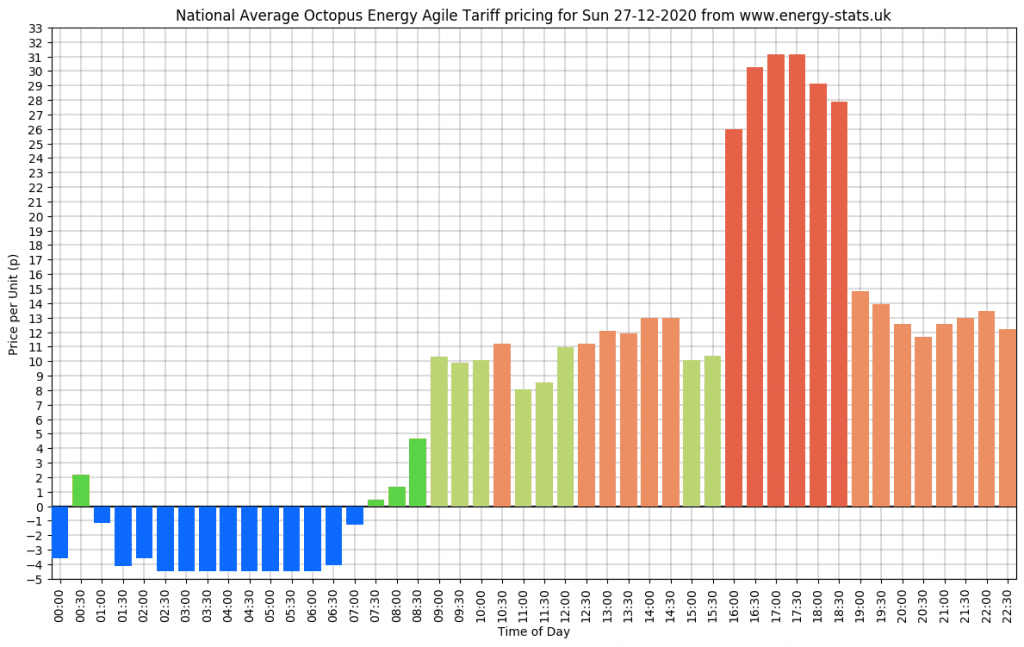
For those that are interested, here’s the unit pricing/colour code from my Aug 2020 script.
  if val < 0:
      col.append('#0d6aff') # dark blue

  if val >=0 and val < 5:
      col.append('#5ad346') # dark green

  if val >= 5 and val <8:
      col.append('#94d963') # medium green

  if val >= 8 and val <11:
      col.append('#bcd573') # light green

  if val >= 11 and val <20:
      col.append('#ec8f62') # orange-ish

  if val >= 20:
      col.append('#e56249') # red
There are no standards to adhere to when it comes to colours, everyone will have their own view of where the boundaries lie.
After quite a bit of tinkering during development these are just what I landed upon as they look right to me.
May 2021 Update
Towards the end of 2020 into the early part of 2021 the wholesale price of electricity rose dramatically. And as the Agile tariff is based on these daily wholesale costs Agile prices have risen too.
This has left the daily pricing graph with a bit of a problem. As noted earlier in the FAQ, I came up with the colour ranges in August 2020 when daily prices were much lower. ie, we were all rocking 8p daytime electricity.
The price ranges I used were hardcoded into the graph and are now not particularly relevant against higher baseline wholesale pricing. ie, we haven’t seen much green for weeks now.
So I needed to come up with an alternative solution. What I’ve come up with is going to be based around Octopus standard fixed tariff pricing. Currently the OE-FIX tariff of 21st April 2021.
https://api.octopus.energy/v1/products/OE-FIX-12M-21-04-09/
As you can see from this graph, the price of previous Octopus fixed tariffs barely changed in 2019 and 2020 but have taken a real upturn in the past 6 months. Which I assume mirrors Octopus longer term outlook of the electricity market?
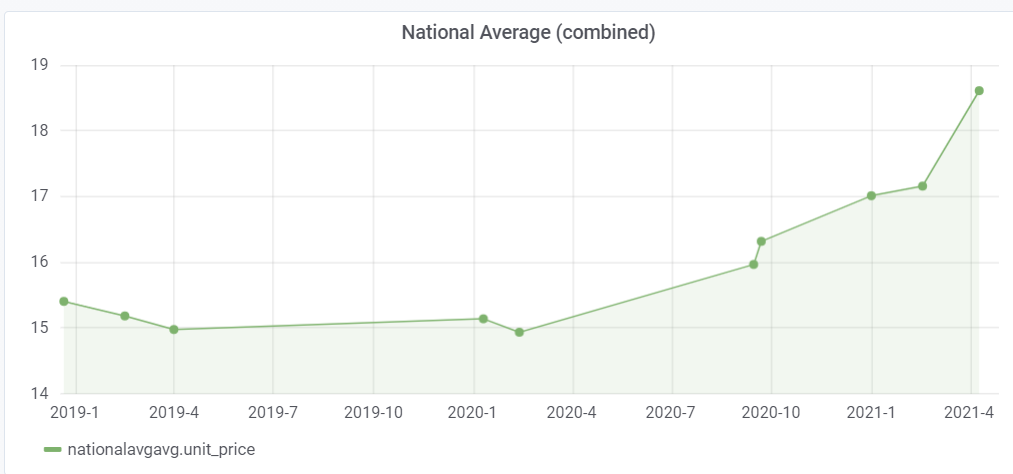
As of May 2021 the national average price of the fixed tariff is 18.6p per unit (averaged from across all 14 DNO regions).
Moving forward this is the figure I’m going to use to drive the daily pricing graph.
- Anything BELOW the fixed tariff price each day will be a shade of green.
- Anything ABOVE the fixed tariff price each day will be a shade of orange/red.
- Negative pricing will stay its usual blue colour.
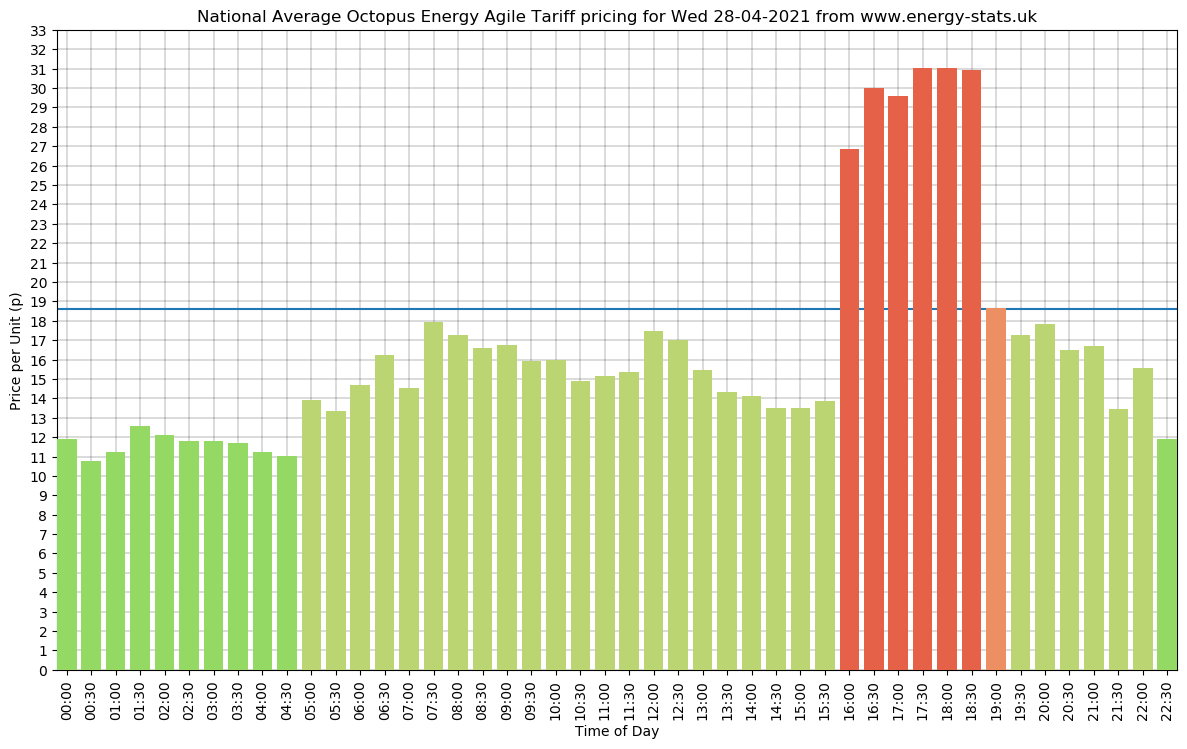
Here’s how the new graph would look as of late April 2021.
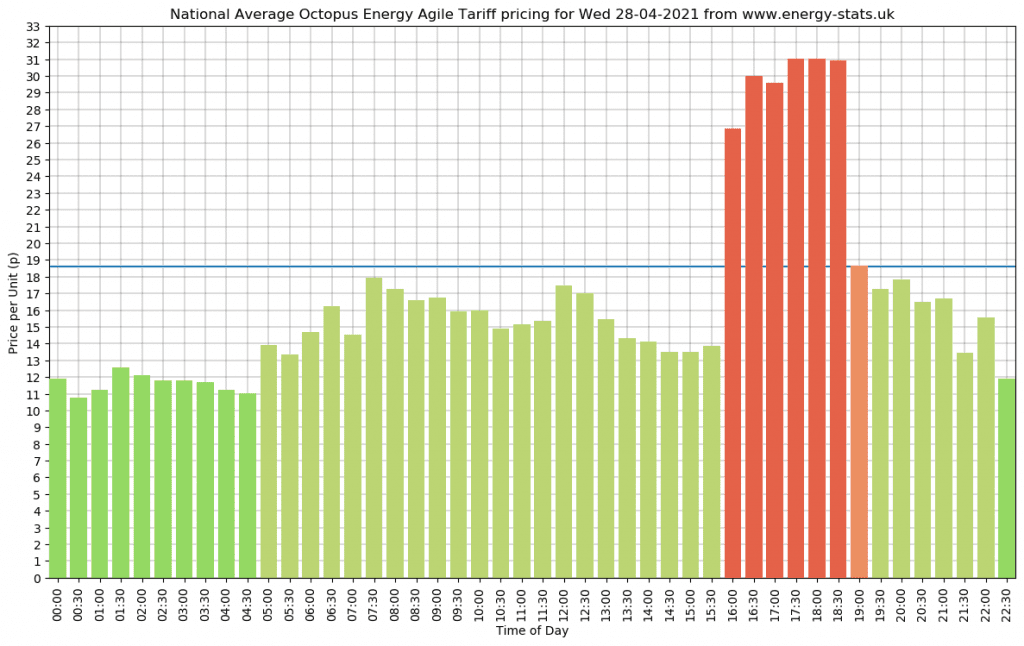
The thinking is that with Agile you’re always looking to beat the standard fixed tariff by shifting your consumption. So the green and orange/red 30 minute slots should instantly show when you’re able to shift for the good and also avoid shifting.
I hope to make this whole process dynamic. So that if Octopus change the standard fixed pricing in the coming months, either up or down, then the daily graph script will pick up those changes and work off the new fixed price. Be that a reduction back down to 15p or god forbid a rise to 20p and beyond.
Finally, I’ve added a new horizontal line to show the average fixed tariff price each day, just as a reminder as to where the rest of the electrical market is currently at compared to Agile.
Some followers may accuse this change of shifting the goalposts to ‘get more green’ on the graph, but the reality is that the goalposts of the wholesale electricity market are constantly moving. I thought it was time that the daily graph evolved too.
June 2021 Update
On reflection, maybe using a tariff that is fixed for 2 years, like the OE-FIX tariff isn’t the best for comparision.
So I’ve altered the daily graph tweet slightly to now use Octopus Standard Variable Tariff.
As you can see over the past few years, the Octopus standard variable tariff (SVT) has also been up the rise.
But because this tariff can change with 30 days notice it is a little less forgiving than the 2 year fixed.
Probably because the 2 year fixed has to make to some longer term assumptions about the future wholesale price whereas the SVT can be a little more reactive.
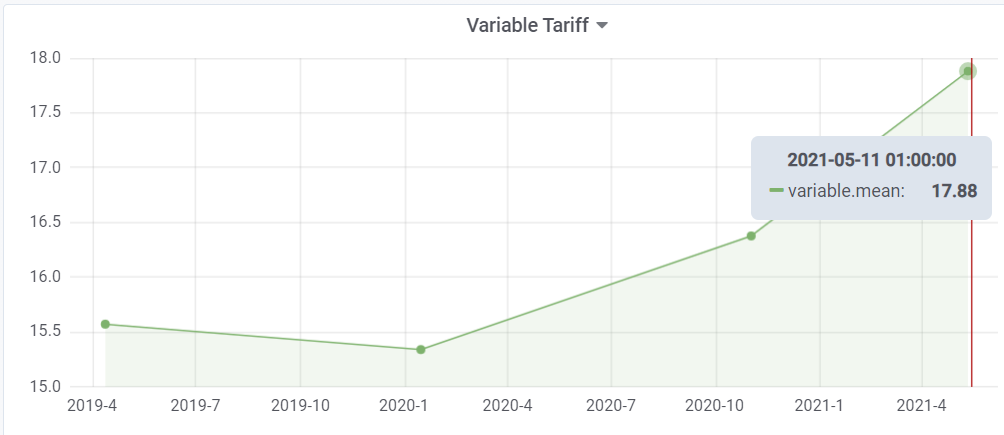
Here is how both tariffs compare as of June 2021
- Standard Variable Tariff: 17.88 per unit
- 2 Year Fixed Tariff: 18.6p per unit
Note: these are ‘national average’ prices across all 14 UK regions. Your own UK region may be higher or lower.
Below shows the standard variable tariff pricing as of early June 2021 as an example.
- Northern Scotland: 18.47p
- Southern Scotland: 17.6p
- Yorkshire: 17.0p
- South Western England: 18.7p
- Southern Wales: 18.1p
- South Eastern England: 18.5p
- Southern England: 17.6p
- North Western England: 17.5p
- North Eastern England: 17.3p
- West Midlands: 17.6p
- Merseyside / North Wales: 19.4p
- London: 17.5p
- East Midlands: 17.4p
- Eastern England: 17.9p
You can also enter your own postcode and find your own region specific tariff pricing here:
https://octopus.energy/tariffs/
As always, I will see how this change goes over the next few months.
I’m not adverse to changing things if there is a distinct change in wholesale prices to ensure that graph shows a sensible real world comparison.
Thank you for your continued support.
August 2021
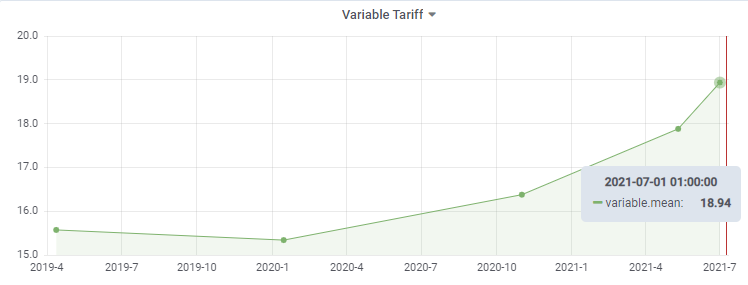
So it seems that Octopus stopped using the VAR-19-04-12 tariff (and sub tariffs) a little while ago and their current variable tariff is now VAR-21-07-02
https://api.octopus.energy/v1/products/VAR-21-07-02/
Here’s the latest pricing across all regions.
- Eastern England: 18.98p
- East Midlands: 18.48p
- London: 18.89
- Merseyside / North Wales 20.09p
- West Midlands: 18.72p
- North Eastern England: 18.39p
- North Western England: 18.30p
- Northern Scotland: 18.96p
- Southern Scotland: 18.53p
- South Eastern England: 19.66p
- Southern England: 18.81p
- Southern Wales: 19.32p
- South Western England: 19.74p
- Yorkshire: 18.22p
That means the average across all 14 DNO regions has now risen from 17.88p to 18.94p and as such the graph colours will be driven by this new price.
It is on my to-do list to now and try and automate this process so that I don’t have to manually track the every changing variable tariff information.
September 2021 Update
After weeks and months of Agile leading the way with high prices, the fixed tariffs have started to catch up. Even Octopus Go has been brought into line.
So I have decided to go back to Octopus 2 year fixed tariff as the comparison for Agile pricing.
https://api.octopus.energy/v1/products/OE-FIX-24M-21-09-23/
OE-FIX-24M-21-09-23 gives us the following prices
- Eastern England 24.6p
- East Midlands 24.1p
- London 24.1p
- Merseyside and Northern Wales 26.3p
- West Midlands 24.6p
- North Eastern England 23.7p
- North Western England 24.0p
- Northern Scotland 25.0p
- Southern Scotland 24.7p
- South Eastern England 25.1p
- Southern England 24.5p
- Southern Wales 24.8p
- South Western England 25.4p
- Yorkshire 23.7p
With a nationwide average of 24.6p
The other reason to make the change back to the fixed tariff for comparison is that these OE-FIX-24M-21-09-23 prices are almost identical to the off-peak parts of Go and the Go Faster variants. And many folk are looking for that daily Go versus Agile comparison.
As always, I make no apologies for making these changes. I’m just trying to show the pricing info in the format I think looks best. Just trying my best!!
If you find this information useful and are thinking of joining Octopus Energy, please consider using my referral code or ‘buy me a coffee’ to help support running costs of the website.
Using this referral code will gift you £50 of free credit after signup:
https://mickwall.octopus.energy
We can also be found on Twitter, please follow us @energystatsuk for daily Agile tariff pricing graphs and summaries.
Also, be sure to check out our Dashboard, Download Historical Data and OctoChargeCalc features to help you decide whether these tariffs are the right fit for you.
Note: The past performance of energy pricing is not necessarily a guide to the future.