What to expect from this article
Warning! I go a bit deep in this Top of the SCOPS article.
Yes, I know I have a previous form for going deep. LOL.
But the Vaillant charts referenced in the article have been something I’ve been trying to document and convey for a long time now and this seems a good time to explain them and share.
In this blog post I start off by exploring the technical limitations of the Arotherm range in heating mode, showing differences in smaller and larger models and how you can check how your own heat pump is performing.
I then started to write the hot water section expecting to find similar differences between smaller and larger heat pumps, but I was surprised that I didn’t. So the hot water section became a deep dive all of its own, focused around pushing the limits of hot water production when 20C outside.
Sorry about that. The section just got carried away with itself.
But I do think the content is all relevant to the core subject of the article.

Table of Contents
Use the Table of Contents below to jump straight to the section that matters most or scroll through at your own pace.
This article is part of my wider series of Vaillant Arotherm guides, aiming to demystify the settings that matter most for efficiency and comfort.
Vaillant Arotherm Heat Pump Guide & User Manual
Smaller Heat Pumps will never reach Top of the SCOPS
Owning a 5kW Vaillant Arotherm since 2022 and tracking its performance via Open Energy Monitor sometimes leads to more questions than it answers.
One major question from me has always been, “Why does my little 5kW heat pump lag behind the performance of other installations on heatpumpmonitor.org?”
Of course, if I ran my heat pump with an overall lower flow temperature then yes, the performance would improve. That’s heat pump 101.
But the more I dug into the numbers, the more the picture became clearer to me that there is one factor you can’t do much about.
Bigger heat pumps perform better than smaller heat pumps (when all other factors are equal).
In this blog post I hope to explain why this happens and how you can check yourself if your Arotherm heat pump is performing as per the manufacturer specifications.
Before we continue, I must stress this article DOES NOT recommend you go bigger than you need to on your choice of heat pump just to chase some extra SCOP.
This article is just a technical observation of the facts. But we do need to talk about this:
Arotherm Defrost-Gate (especially the underperforming 7kW)
Whilst the Arotherms seem capable of hitting the maximum kW outputs in warmer temperatures, caution must be advised when looking at the output tables for 3C and colder in the UK.
Installers and homeowners are finding that whilst the heat pumps can reach the numbers in short peaks, they are unable to achieve the badge output of the heat pump over sustained periods due to defrosts.
The thinking is that the UK is more humid than other regions, so we get more defrosts when 3C and below. This leads to more defrost cycles that puts a dent on the amount of heat that can be transferred to the house over a few hours. Because generated heat is used (and lost) to defrost the outside unit, the house loses a bit of heat, so the heat pump then has to work hard to get back to room temperature.
If you are in a climate where defrosts aren’t such a concern you would have a higher average output as you’re not losing heat to defrost cycles.
There has been much discussion and investigation over on the Open Energy Monitor forum about this
https://community.openenergymonitor.org/t/vaillant-maximum-output-capacity-testing/27221
Basically, if your heat loss is close to the badge output of the heat pump (ie your heat loss is 7kW) you may want to consider the next model size up (10kW).
BUT, you have to be confident that you have an “accurate” heat loss. And that is a keyword, accurate.
Trystan Lea (of Open Energy Monitor) wrote an article showing how easy it is to accept the defaults in the MCS sizing process and end up with way too large a heat loss. And this is a very BAD thing.
https://trystanlea.org.uk/roombyroomheatloss
You should ALWAYS go for the most appropriate heat pump model based on the accurate heat loss of your property and location. A competent installer like a Heat Geek, who has experience of doing heat loss surveys should be able to choose the right heat pump for you.
But they also need to know about any limitations around the heat pump chosen, like the issues raised here with the Arotherm models and defrosts.
The lowest modulation of the heat pump can be just as important as the maximum output.
Lowest modulation at 7C outside of each Arotherm model (35 flow temperature)
- 3.5kW / 5kW : ~2.2kW
- 7kW : ~3.2kW
- 10kW / 12kW : ~5.8kW
If you go too big, the heat pump will spend more of the winter cycling (intermittently putting heat into the house). This usually occurs in milder temperatures when the heat loss of the house is less than the minimum output of the heat pump.
Once the heat loss of the house is larger than the minimum output, this is when you see longer or constant run times.
But before I go on a wee downer on smaller heat pumps, let’s remember that my 5kW system in a 1930’s semi detached house performed pretty well in its second winter as summarised here.
I bloody love me little Vaillant, I think it’s ace!!!
My 5kW Vaillant Arotherm Heat Pump
Second Winter With Our Vaillant ASHP
SCOP across 6 months (November 2023 to end April 2024)
- Combined SCOP: 4.1
- Heating Only SCOP: 4.2 (73% of output)
- Hot Water Only SCOP: 3.8 (27% of output)
SCOP = seasonal coefficient of performance.
i.e. for every 1kWh of electricity put into the heat pump, we get 4.1kWh of heat out.
Or as other people sometimes call this, the heat pump is 410% efficient.
There are other 5kW models on heatpumpmonitor.org performing better than mine, at around 4.4 annual SCOP. They are beating me by a) running a lower heating flow temperature and b) not generating as much hot water as me.
The issue in hand (and will be explored in this article) is that there are 10kW and 12kW models of heat pump that have almost exactly the same design conditions as mine (around 40C flow when -3C outside) listed on https://heatpumpmonitor.org/ that are getting close to an annual combined SCOP of 5. Whilst I am getting a SCOP just over 4.
FACT: A 5kW Vaillant (5kW heat loss, designed for 40C at -3C) will perform worse than a 10kW Vaillant (10kW heat loss, designed for 40C at -3C).
This is just down to the fact that bigger heat pumps perform better than smaller ones as I hope to explain.
The caveat in that statement is that both systems are like for like, ie well designed and have adequate pipe sizing for the load and are open system (no zoning) etc.
Image credit: The Top of the SCOPS image is used with kind permission of Heat Geek.
The Czech Republic Gold Dust Tables
When I was researching which heat pump to buy I came across this snappily titled Vaillant technical document called “kl-06-e2-verze”.
This document has since become gold dust to me in helping me understand the performance capabilities and limitations of my 5kW unit, and other Arotherm models.
You can still grab the official Vaillant aroTHERM plus technical data sheet here locally on my website: https://energy-stats.uk/wp-content/uploads/2024/10/vaillant-specs-kl-06-e2-verze-01-01062021-2108745.pdf
The document covers the full Vaillant aroTHERM plus range, including the 3.5 kW VWL 35/6, 5 kW VWL 55/6, 7 kW VWL 75/6, 10 kW VWL 105/6 and 12 kW VWL 125/6 air source heat pumps.
Whilst most of the document is indecipherable unless you speak Czech. It’s the tables on pages 34 through to 45 that have been most valuable.
Those tables show the kW output and achievable COP (coefficient of performance) at a variety of outside temperatures, system flow temperatures and unit compressor speeds for each of the 3kW (3.5kW?), 5kW, 6kW, 7kW, 10kW and 12kW models.
I will show some examples in the next section.
Here in the UK we are only able to get the 3.5kW, 5kW, 7kW, 10kW and 12kW Arotherm models.
So we can only assume the 3kW and 6kW listed in the document are EU models only? Maybe there is no 3.5kW version in the EU?
We almost know for certain that the 3.5kW is just a capped version of the 5kW in the same way that the 10kW version is a capped version of the 12kW.
By capped, we mean that both models perform exactly the same up to around 85rps on the compressor. But the lower output models (3.5kW and 10kW) don’t go any higher than around 85 and 90 rps, whereas the higher output models (5kW and 12kW) can reach compressor speeds of 110 rps and 120 rps.
At the bottom end of kW heat output, the 3.5kW / 5kW and the 10 kW / 12 kW modulate down to the same level because they are ultimately the same unit under the hood. They appear just to have been software capped at the upper end from what we can see.
You can see all this from the Gold Dust tables when you dig into them.
Gold Dust Tables Example
So let’s look at how to read the tables by looking at an example.
For each model size of heat pump there are four separate pairs of tables within the document.
One pair of tables for each of the following flow/return temperature combinations
- 35C flow / 30C return
- 45C flow / 40C return
- 55C flow / 47C return
- 65C flow / 57C return
This excerpt is from page 35 of the document, which shows the tables from the 5kW Arotherm at 35C flow and 30C return.
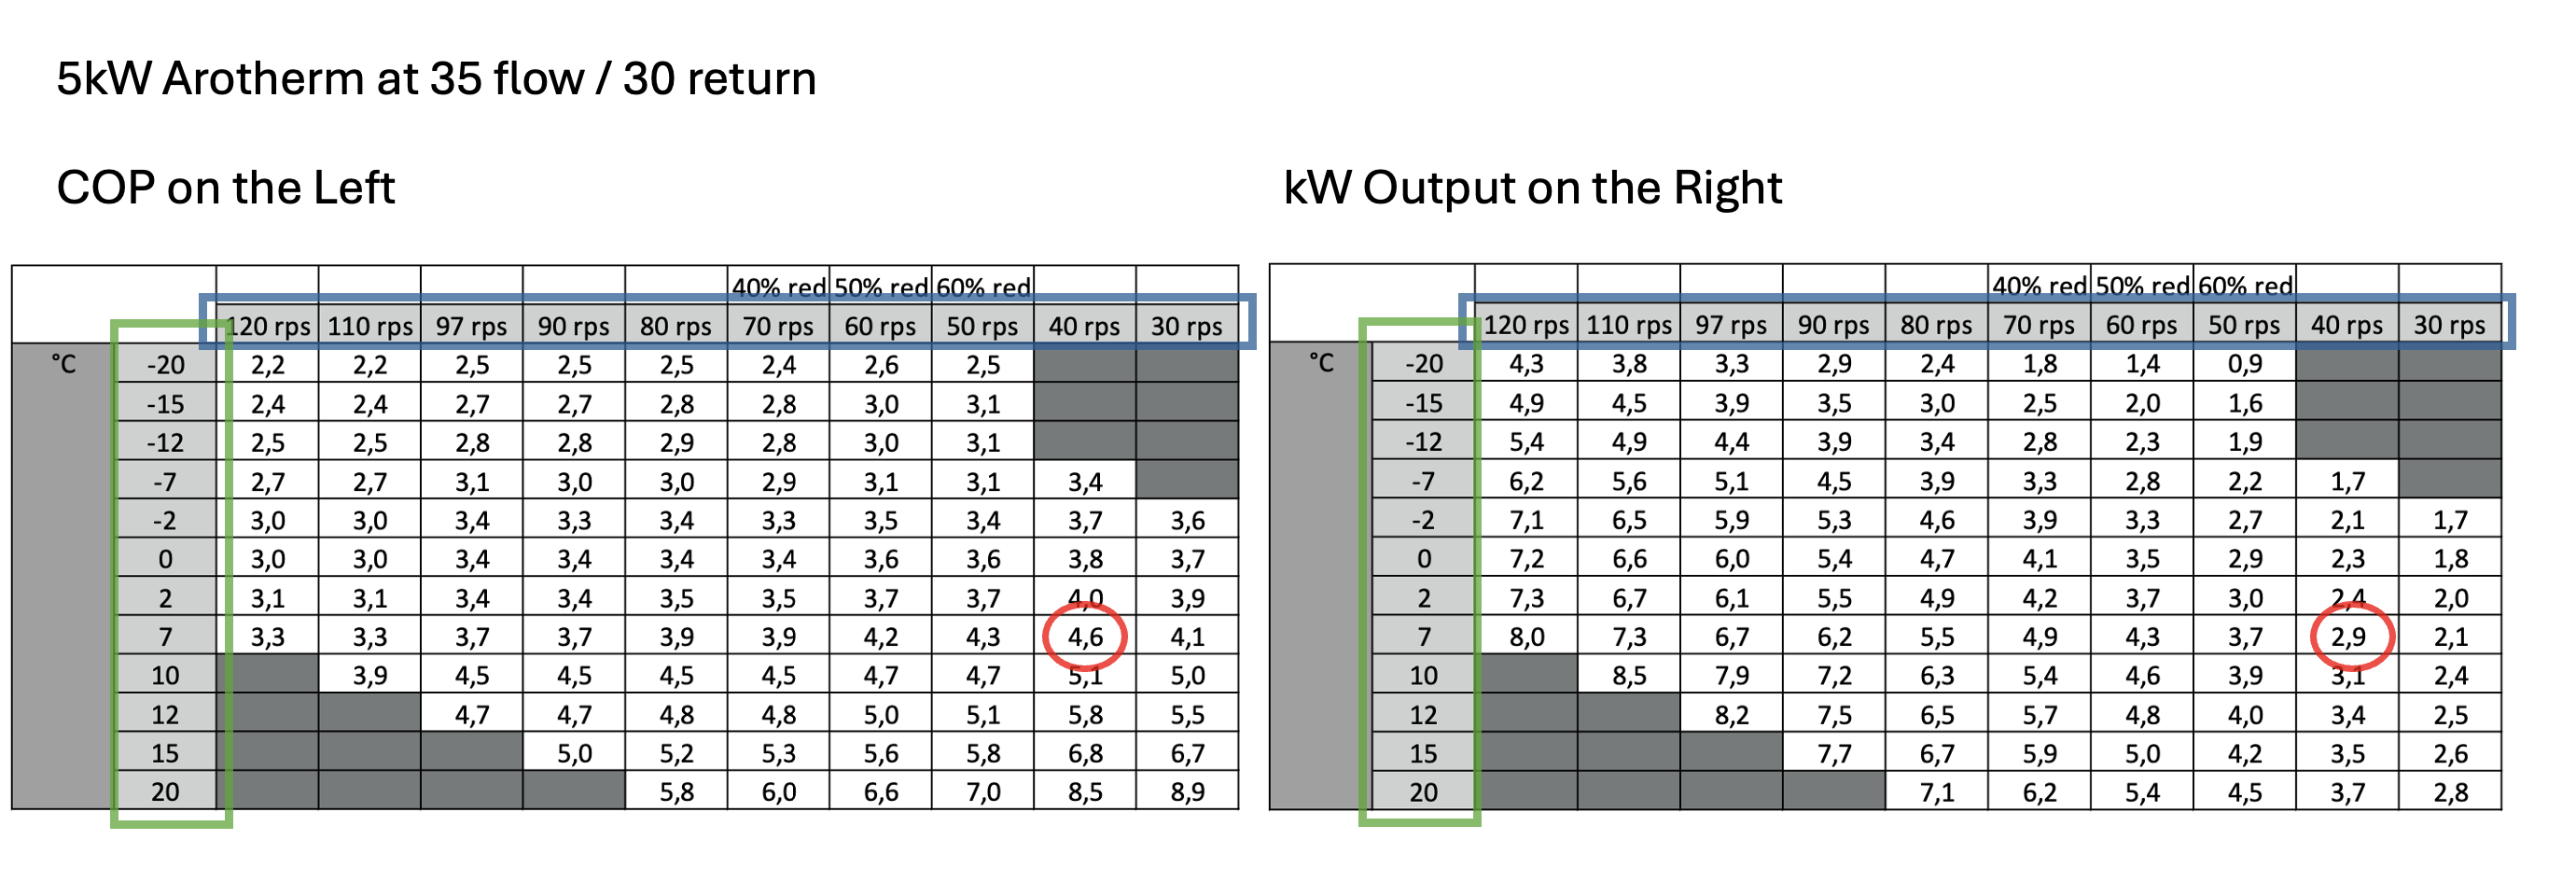
- Green box – Outside Temperature
- Blue box – Compressor Speed rps (revolutions per second)
The two values highlighted with the red circles are matching pairs with expected/achievable COP on the left and kW output on the right.
So for the highlighted values in red we can see the following information
- 35C flow / 30C return
- 7C outside temperature
- 40 rps compressor speed
- 4.6 COP (left hand red circle)
- 2.9 kW output (right hand red circle)
So the table is basically saying that under all those circumstances (35C flow temperature, 7C outside temperature and 40 rps compressor speed) you should get 2.9kW output and achieve a COP of 4.6 from a 5kW Arotherm.
You can also use these values to show you the expected electrical input required at that combination with a simple calculation.
- 2.9 kW / 4.6 COP = 0.63 kW electric required (630 Watts)
If you have all the input values (flow temp, outside temp and compressor speed) then these tables are a fantastic way to confirm that your heat pump is working to specification.
Vaillant Arotherm Performance Tables and Datasheets
If you’re trying to make sense of the official Vaillant aroTHERM Plus data, this new article on Vaillant Arotherm Performance Tables and Interactive Widget, created in November 2025 breaks it all down. It explains how to read the manufacturer’s performance tables, shows real examples for each model, and includes an interactive widget that lets you check expected COP, heat output, and power input for any set of conditions. Hopefully this is a useful addition to this existing article.
Vaillant Arotherm Performance Tables & Interactive Widget
How do I see what speed my compressor is running at?
As you can see from the Czech Tables example above, the compressor on a 5kW heat pump can work in the range from 30 rps right up to 120 rps. With rps denoting revolutions per second.
The tables also show that the sweet spot for efficiency (COP) is around 30 rps to 50 rps, depending on outside temperature and system flow temperature.
You can view what your compressor is running at through the VWZ AI Controller using the following menu items.
- Live Monitor
- Compressor Modulation (wait for it to cycle the display)
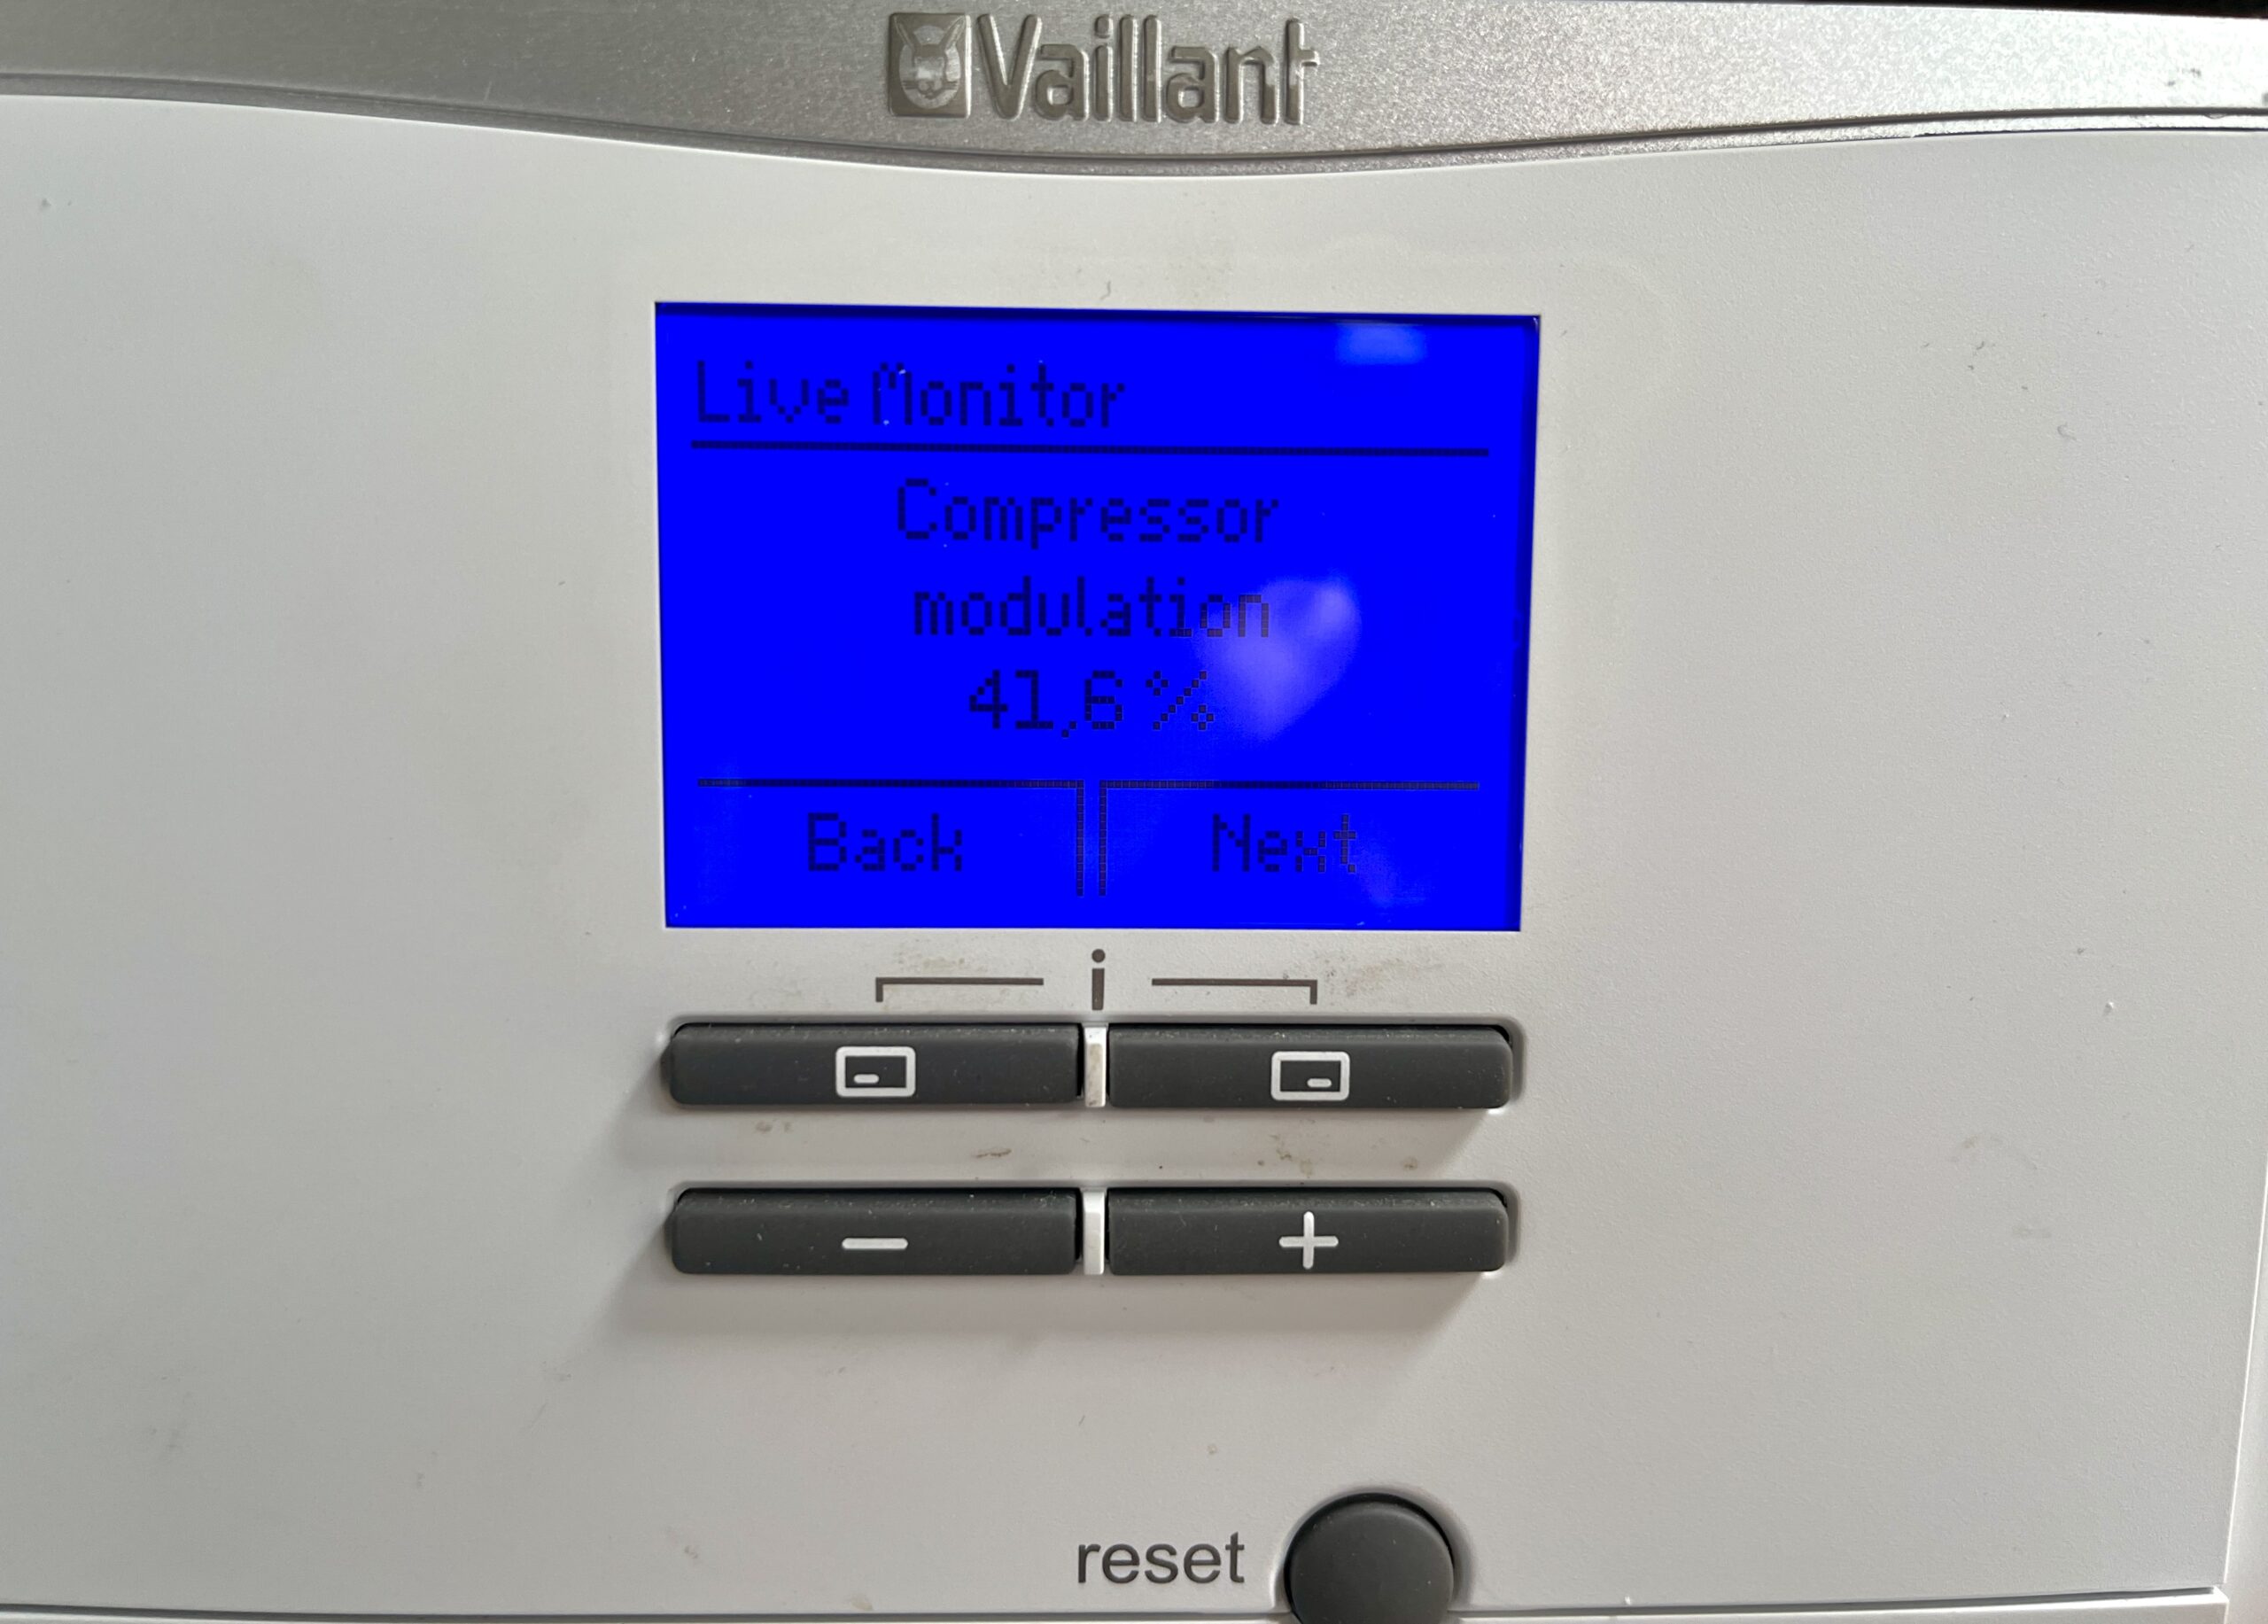
This will show you live feedback of what the compressor is working at right then. Sadly, there is no history available through the VWZ AI Controller.
For whatever reason, Vaillant chose to show compressor usage as a percentage of maximum.
In the photo above, 41.6% is 50 rps (Eco hot water mode).
The maximum compressor speed on the 5kW model (from the Czech tables) is 120 rps.
So 120 x 0.416 = 49.92 or 50 rps rounded up.
Here are some handy tables.
5kW and 7kW (120 rps max)
| rps | % |
| 120 | 100.0% |
| 110 | 91.7% |
| 100 | 83.3% |
| 90 | 75.0% |
| 80 | 66.7% |
| 70 | 58.3% |
| 60 | 50.0% |
| 50 | 41.7% |
| 40 | 33.3% |
| 30 | 25.0% |
10kW (85 rps max)
| rps | % |
| 85 | 100.0% |
| 80 | 94.1% |
| 70 | 82.4% |
| 60 | 70.6% |
| 55 | 64.7% |
| 50 | 58.8% |
| 45 | 52.9% |
| 40 | 47.1% |
| 35 | 41.2% |
| 30 | 35.3% |
12kW (110 rps max)
| rps | % |
| 110 | 100.0% |
| 105 | 95.5% |
| 97 | 88.2% |
| 90 | 81.8% |
| 80 | 72.7% |
| 70 | 63.6% |
| 60 | 54.5% |
| 50 | 45.5% |
| 40 | 36.4% |
| 30 | 27.3% |
Czech Tables versus Real World (Heating)
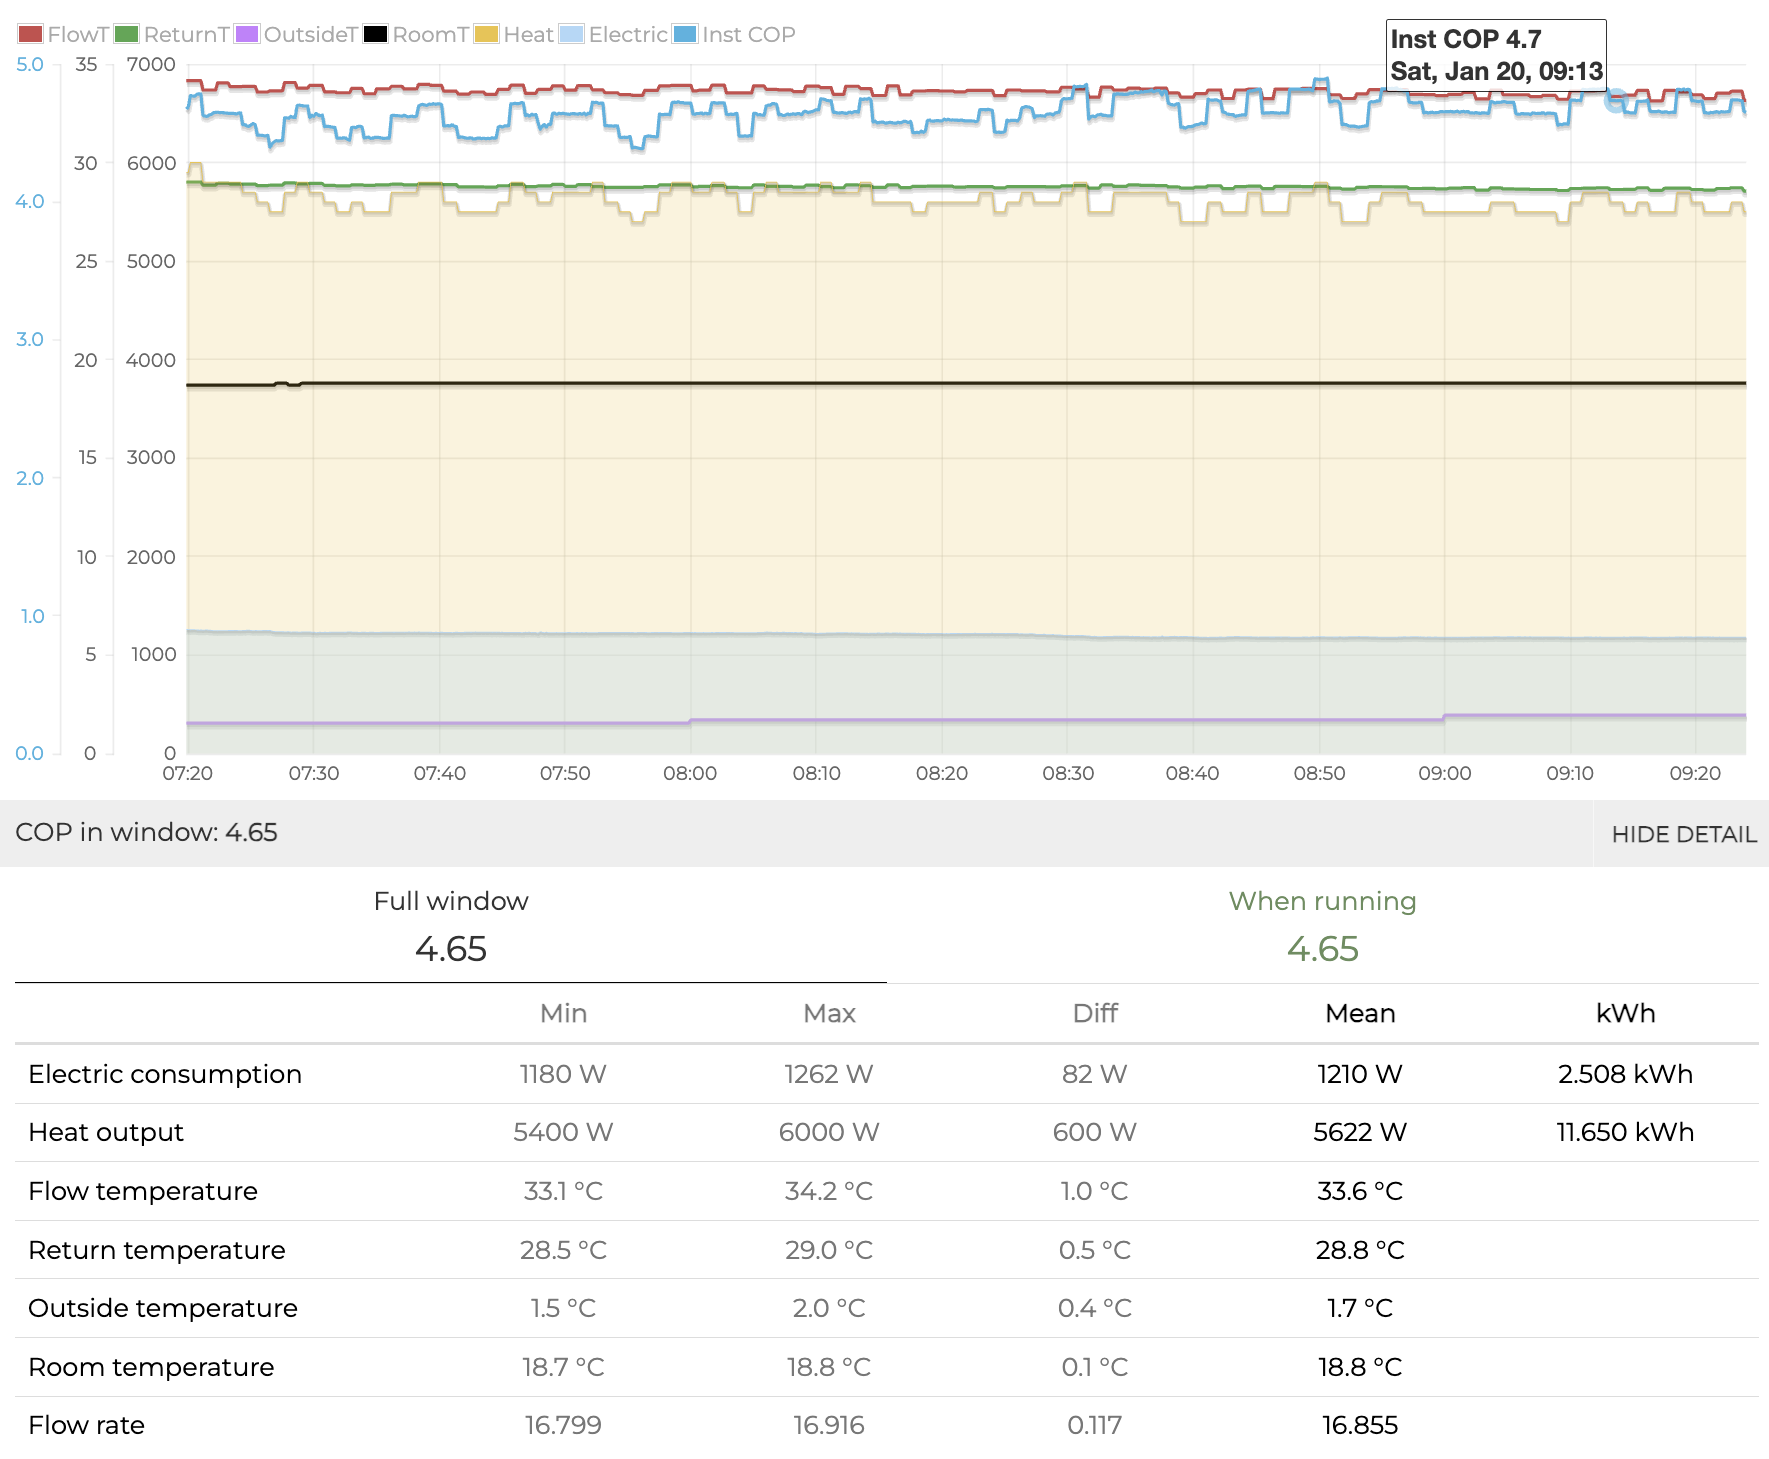
Let’s look at another example from the Czech Tables, again from the 5kW model.
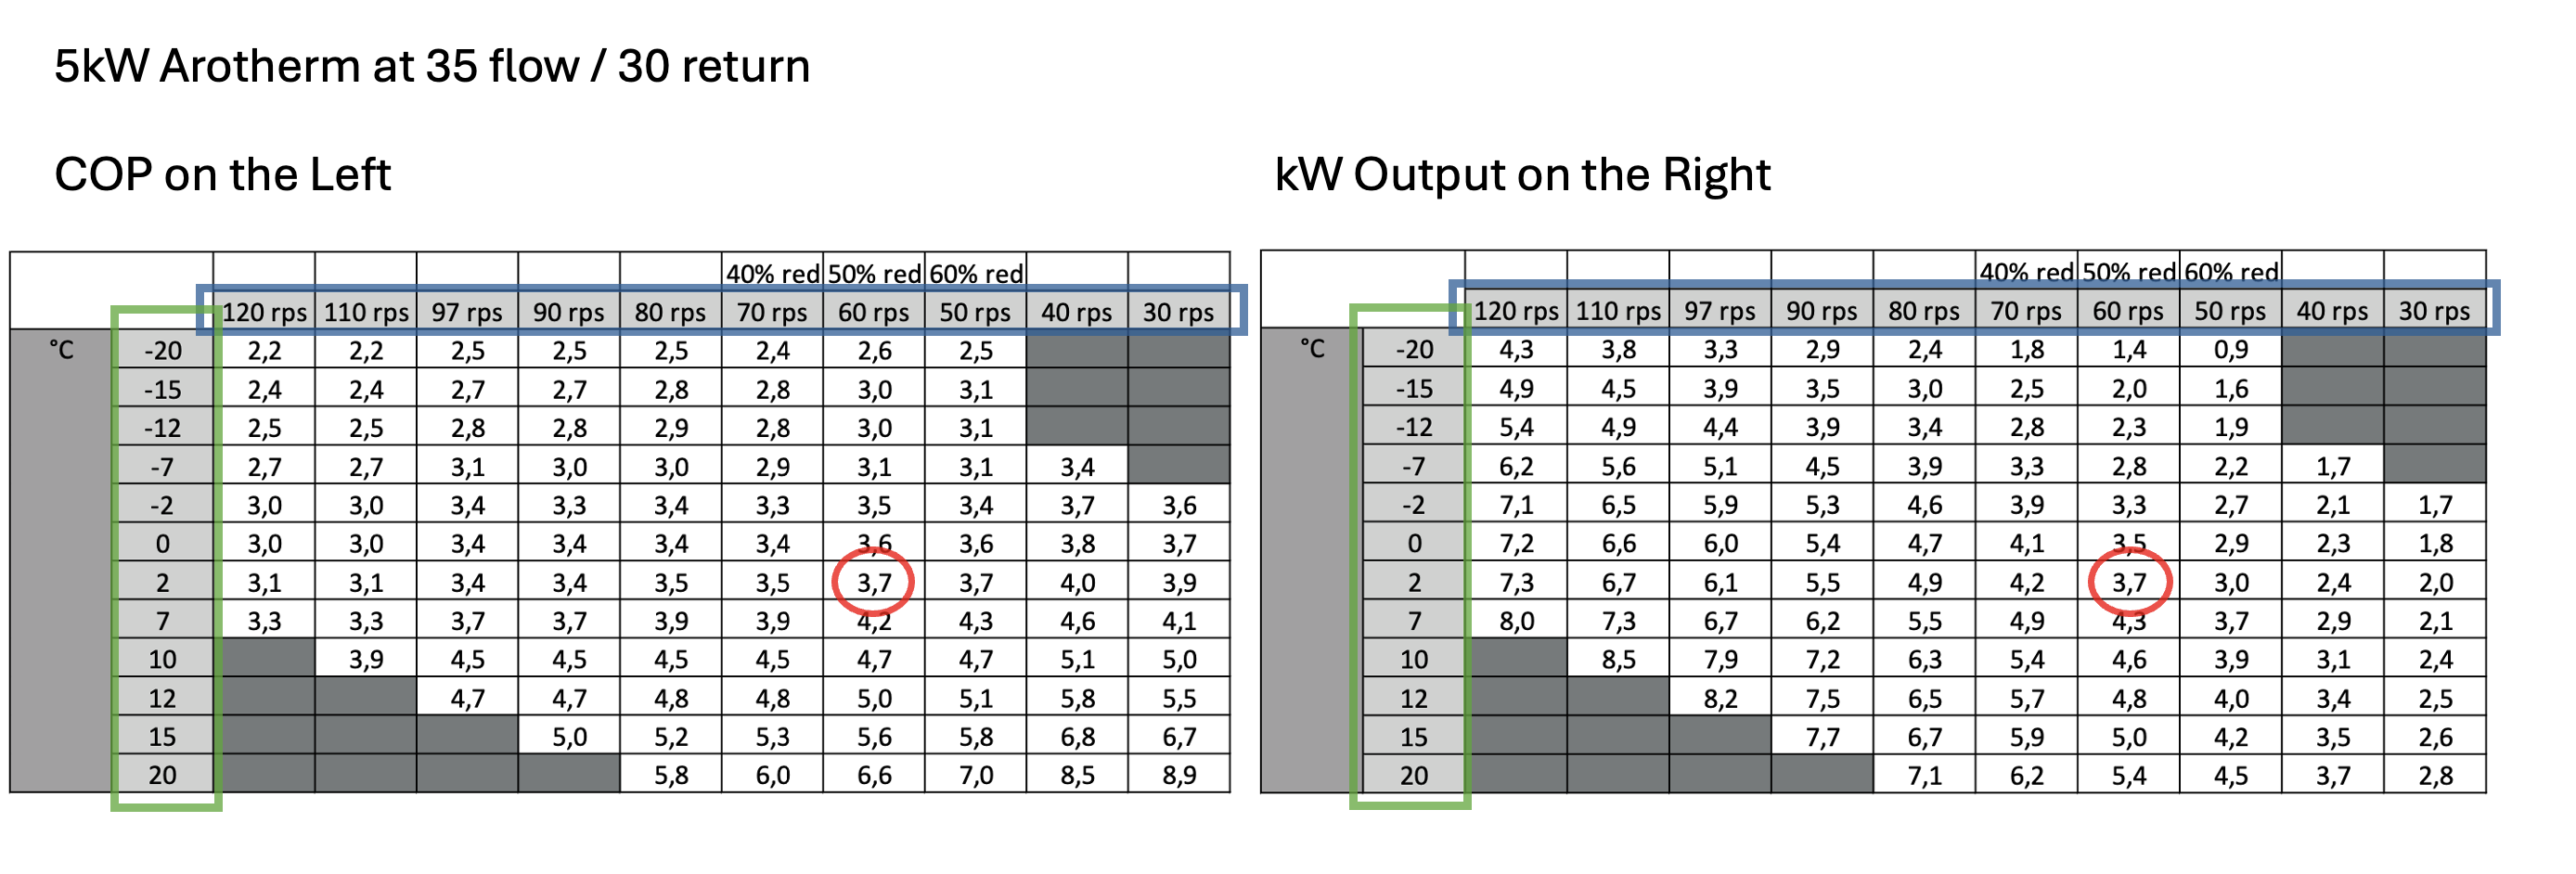
- 35 flow / 30 return
- 2C outside temperature
- 60 rps compressor
- 3.7 COP
- 3.7 kW output
I monitor my heat pump with Open Energy Monitor so we can delve deep into how the system is performing. If we look at this 6 hour period from 3pm to 9pm on 8th January 2024 we can find a snapshot where the parameters almost match the ones in the Czech tables.
You can view this exact period for yourself here:
https://emoncms.org/energystatsuk?mode=power&start=1704726135&end=1704747150
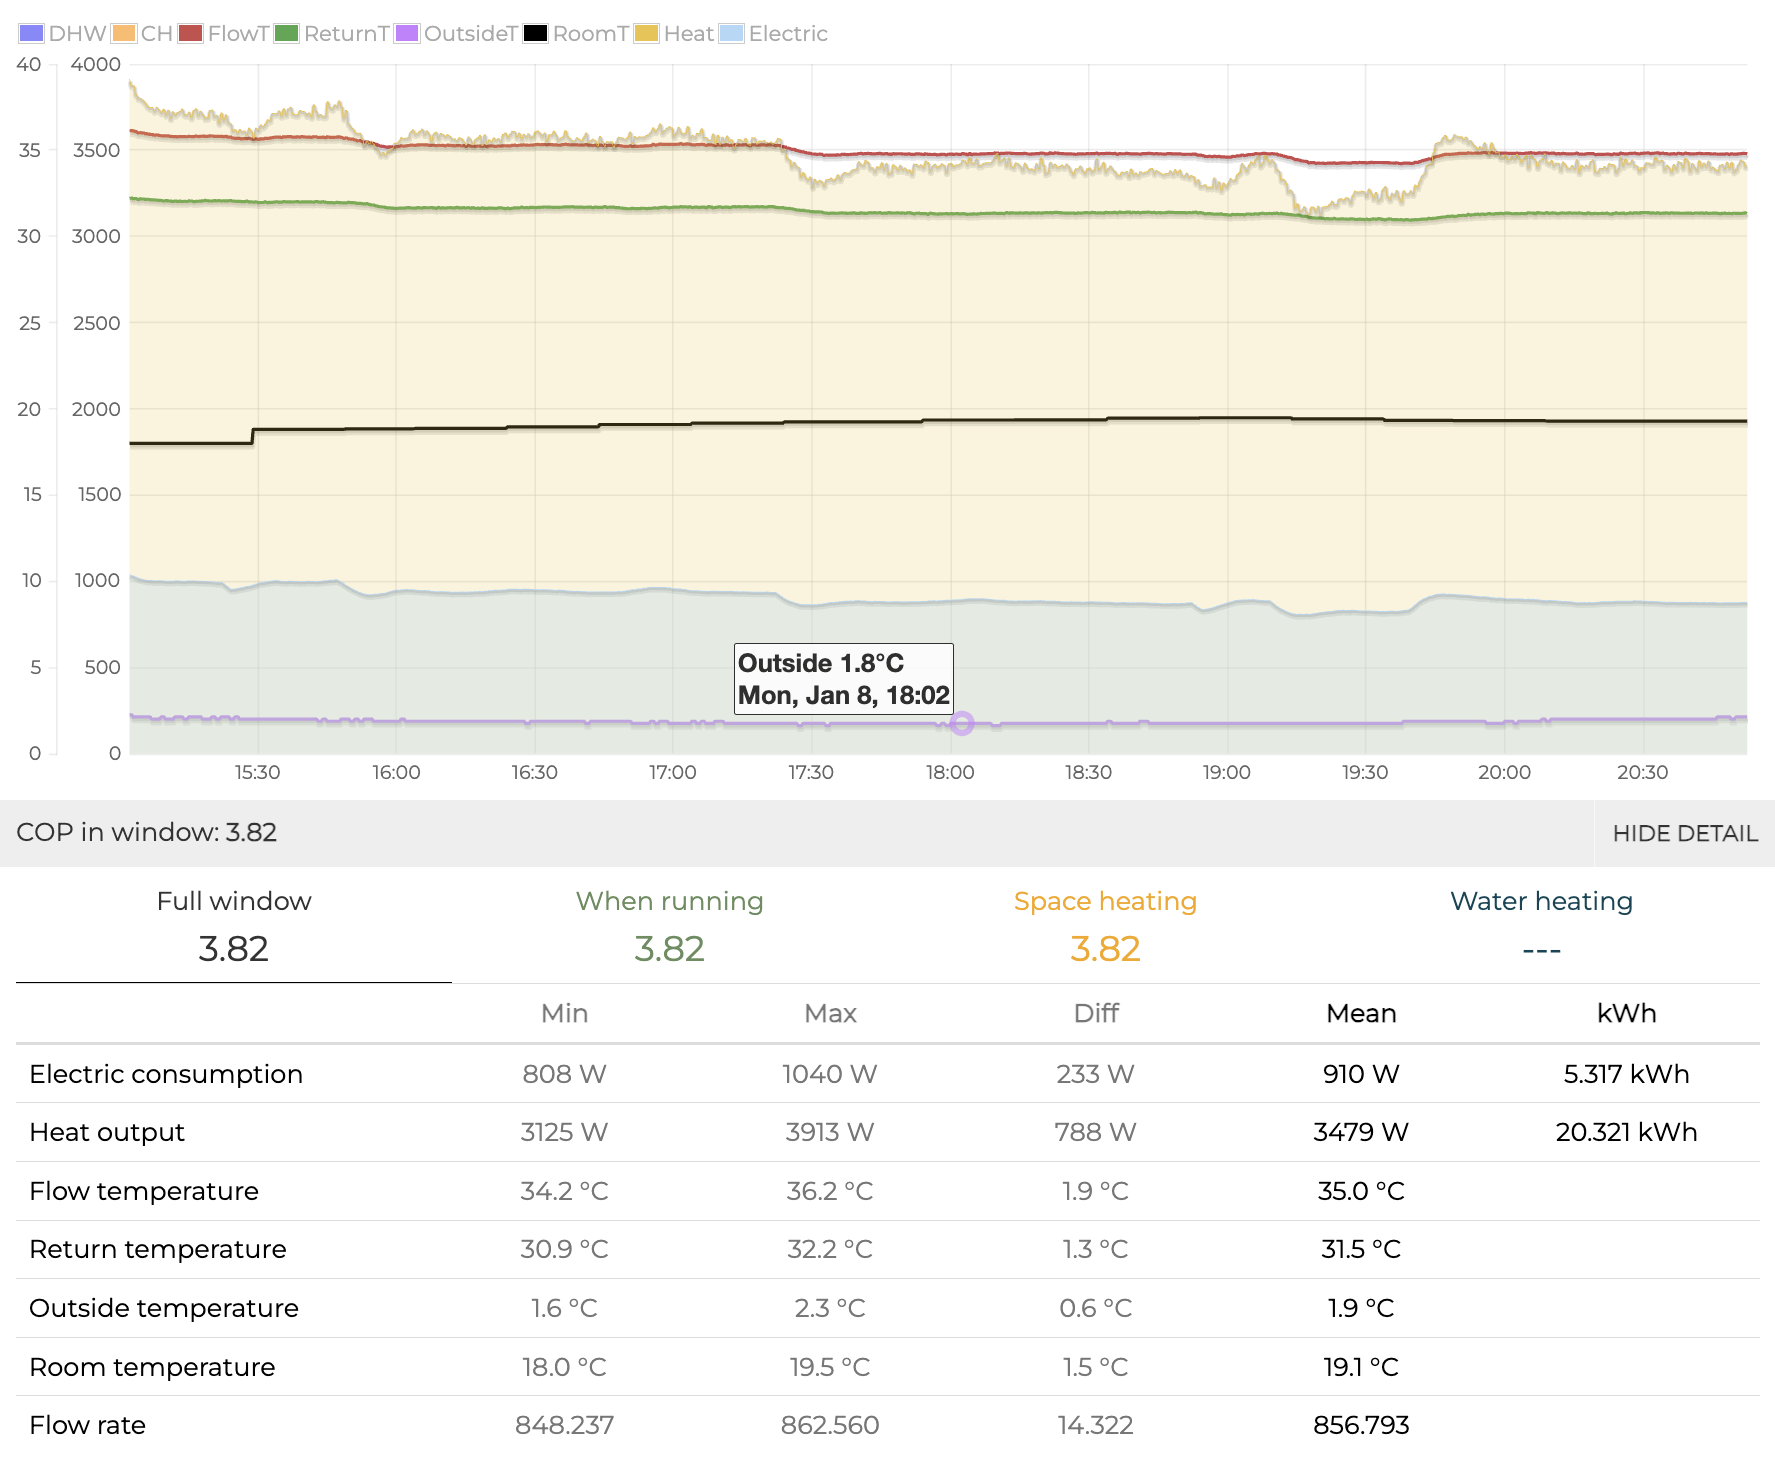
Here is a side by side comparison of Czech Tables versus Real World
| Czech Tables | Real World | |
| Flow Temp | 35C | 35C |
| Outside Temp | 2C | 1.9C |
| Heat Output | 3.7kW | 3.5kW |
| COP | 3.7 | 3.82 |
| Electric Input | 1kW (calculated) | 0.9kW (actual) |
Note: I double checked under the hood and the compressor was running around 55 rps at this time, so almost bang on the 60 rps of the Czech Tables.
So I’m happy that my system is hitting expected performance during this 6 hour window.
This shows that the Czech tables are a great way to cross reference whether your system is performing as well as it should be and to specification.
If your system is not hitting the expected numbers in the Czech tables, this could point to potential issues with your setup which may need further investigation.
Just to start sowing the underlying seed of the article. Where I’m seeing 3.8 COP on my 5kW model in this example, a 10kW Arotherm would achieve a COP of 4.7 under these similar input parameters (35C flow at 2C outside, 40 rps).
Now the following example is from a 10kW Viessmann, but being an R290 heat pump, things should be pretty similar to show an example. 34C flow at 2C outside, 4.7 COP.
Real World Compressor Ranges (Heating)
Over the course of the last winter I picked out a few different times at varying outdoor temperatures and noted the compressor reading from my system.
- 30 rps: 6C outside (and above)
- 40 rps: 5C outside
- 50 rps: 4C outside
- 60 rps: 2C outside
- 70 rps: 0C outside
- 85 rps: -3C outside
So you can see there is a sliding scale with the compressor speed increasing as the outside temperature drops.
But as the vast majority of a UK winter is 4C and warmer, my heat pump spends most of its time in that 30 rps to 50 rps sweet spot range for best efficiency.
Last winter whilst heating, my heat pump ran with steady state long run times when it was below around 6C outside and started to cycle when it was around 7C and above.
I wrote an article here about how the version of firmware your Arotherm is running might affect how your heat pump cycles in this article; Vaillant Arotherm Firmware 351.06.07 Problems (Energy Integral)
Vaillant Arotherm Firmware 351.06.07 Problems (Energy Integral)
Obviously, the compressor speeds, outside temperatures and cycling threshold listed here are from my installation and your numbers may differ.
My installation is a fully open single circuit, no TRV, no zones, no buffers, no separation of any kind. All the pipework has been sized correctly so the system just purrs along low and slow with long run times (when below 6C/7C outside).
I also have the weather compensation curve dialled right down to provide just enough heat into the house.
You can read about Vaillant weather curve here
Optimize Your Vaillant aroTHERM Weather Curve for Efficiency
I go into more detail about the design of my heat pump in various other blog posts, including this one; My 5kW Vaillant Arotherm Heat Pump
My 5kW Vaillant Arotherm Heat Pump
Why does my 5kW perform worse than the 7kW, 10kW and 12kW models?
Having your heat pump monitored with Open Energy Monitor and being part of the https://heatpumpmonitor.org/ project is both a blessing and a curse.
It is an amazing tool, but you do get COP envy.
I have personally chased better performance on both heating and hot water from my heat pump and I did wonder why a 5kW unit could not compete with higher output Vaillant units.
It was only when I started digging deeper into the Czech tables that I could see the reason why.
Basically, the smaller models of Arotherm heat pumps are less performant compared to their larger brothers and sisters.
Let me try and explain with some graphs.
I’ve created the following charts by manually pulling the numbers from the Czech Gold Dust tables and putting them into Excel.
Here is a chart showing the achievable COP for various models at 40 rps compressor (in the middle of that 30 rps to 50 rps winter sweet spot I spoke about earlier) at a flow/return temperature of 35C/30C across various outdoor temperatures.

And here is the same graph, but this time at 45/40 flow and return temperatures.
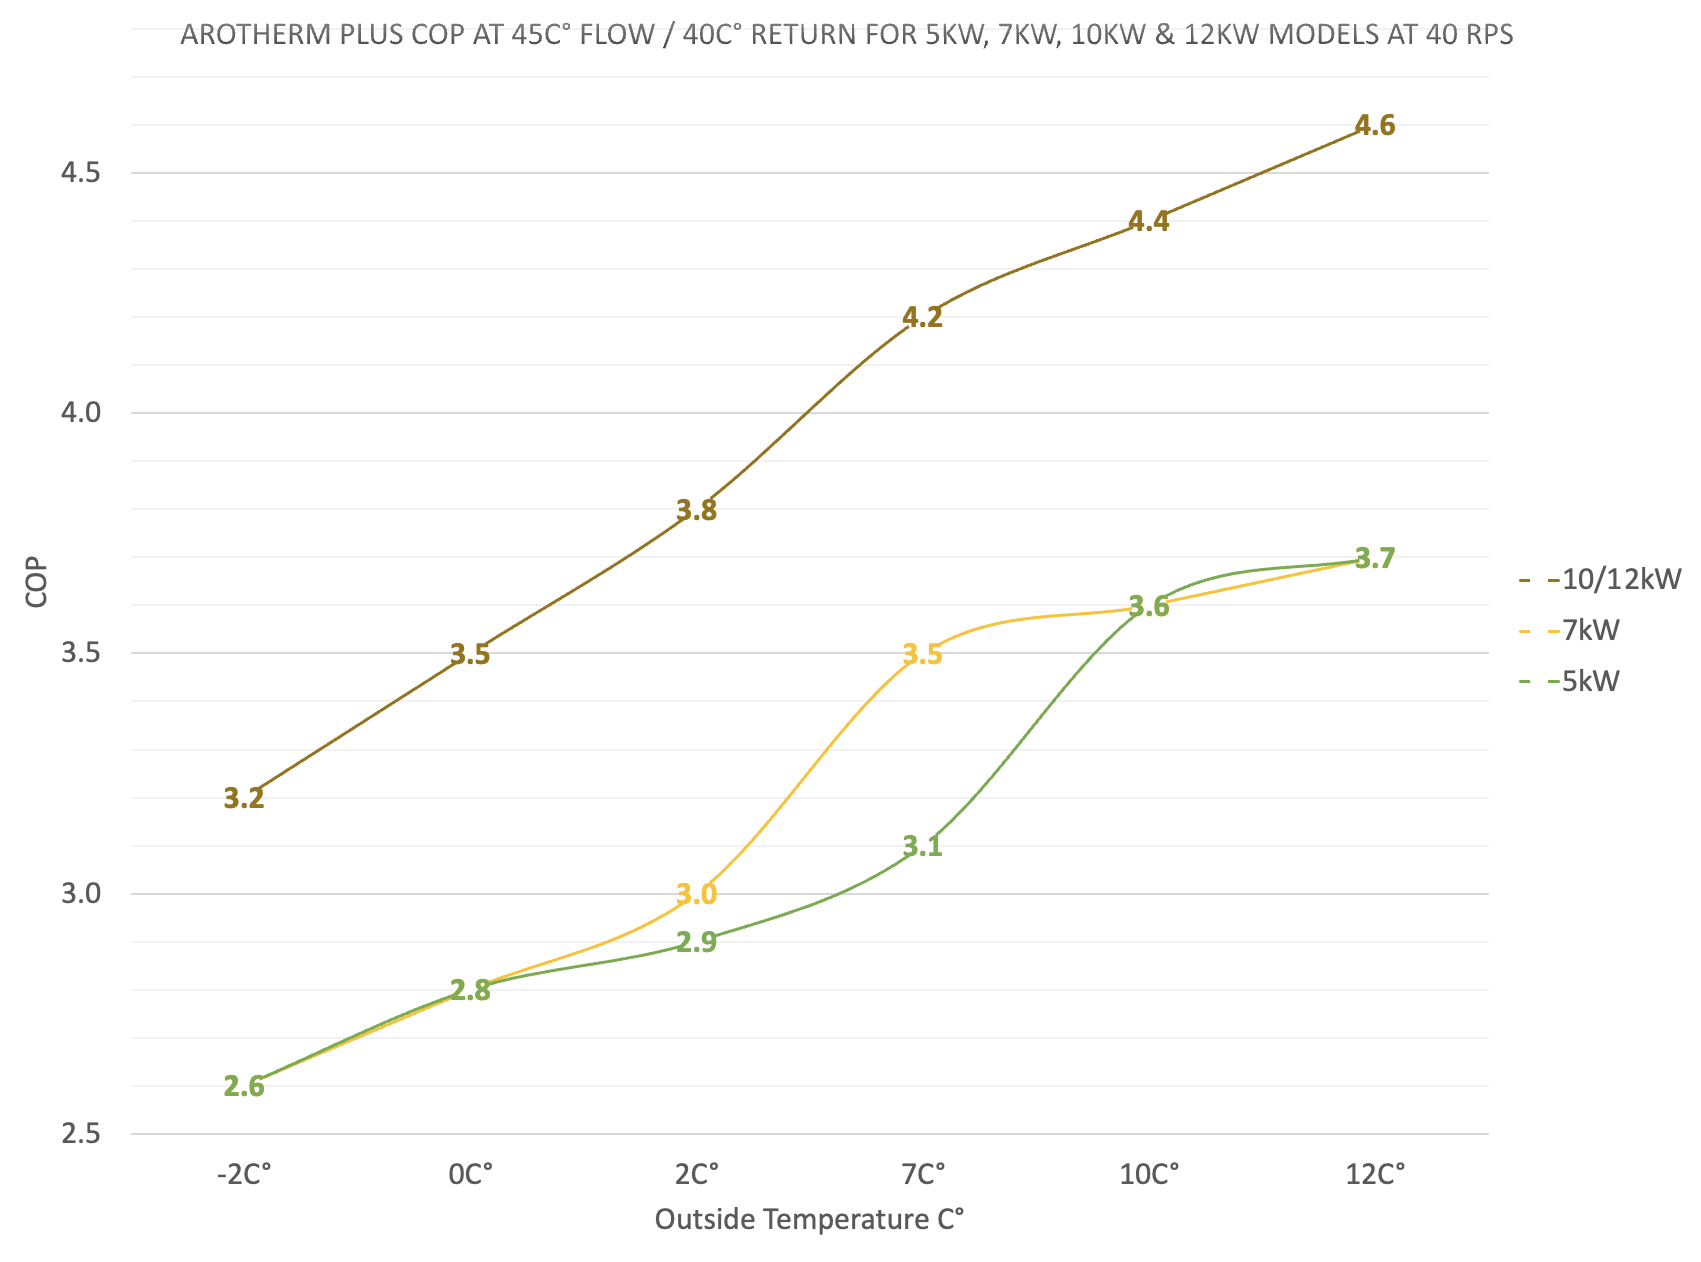
You can see here why my little 5kW model could never match the performance of its larger siblings.
If you own a 7kW model, you can be confident it will outperform a 5kW under the majority of circumstances.
But it’s the performance gains the 10kW and 12kW models get over the 5kW and 7kW that are staggering. Just look at those graphs.
Looking at these numbers, I am confident that the larger 10kW and 12kW heat pumps will start to dominate the https://heatpumpmonitor.org/ charts over time.
If you have a 5kW or a 7kW model and you want to match the larger 10kW and 12kW heat pumps on COP, then you’re going to have to run at a lower overall flow temperature than them to make up for the shortfall.
Not impossible of course, but you’re starting from a disadvantage with a smaller model.
But as I must stress again, these performance differences are no reason to “size up”. You need to get the heat pump that is right sized to your heat loss.
So to summarise, the Vaillant technical documents show that there is a big discrepancy in performance between the smaller and the larger heat pump models. And we have seen the differences show themselves during heating.
But during hot water investigations, things didn’t turn out as I had expected them to.


Real World Compressor Ranges (Hot Water)
The Arotherm has three modes of operation when generating hot water: Eco, Normal and Balanced.
I go into detail about all three in this separate Hot Water Mode post that is well worth a read.
It is widely agreed that if you want high performing hot water runs on a Vaillant then Eco mode is the way to go.
This is because Eco mode limits the compressor to:
- 50 rps (3.5 kW, 5 kW & 7 kW models)
- 40 rps (10 kW & 12 kW models)
Whereas Normal mode can run the compressor right up to the maximum of the unit (85 rps, 110 rps or 120 rps depending on the model)
My 5 kW model runs at 110 rps in Normal mode for example.
Here is a comparison from the Czech Tables showing the difference in a 7kW Arotherm between Eco mode (50 rps in yellow) and Normal mode (110 rps in purple).
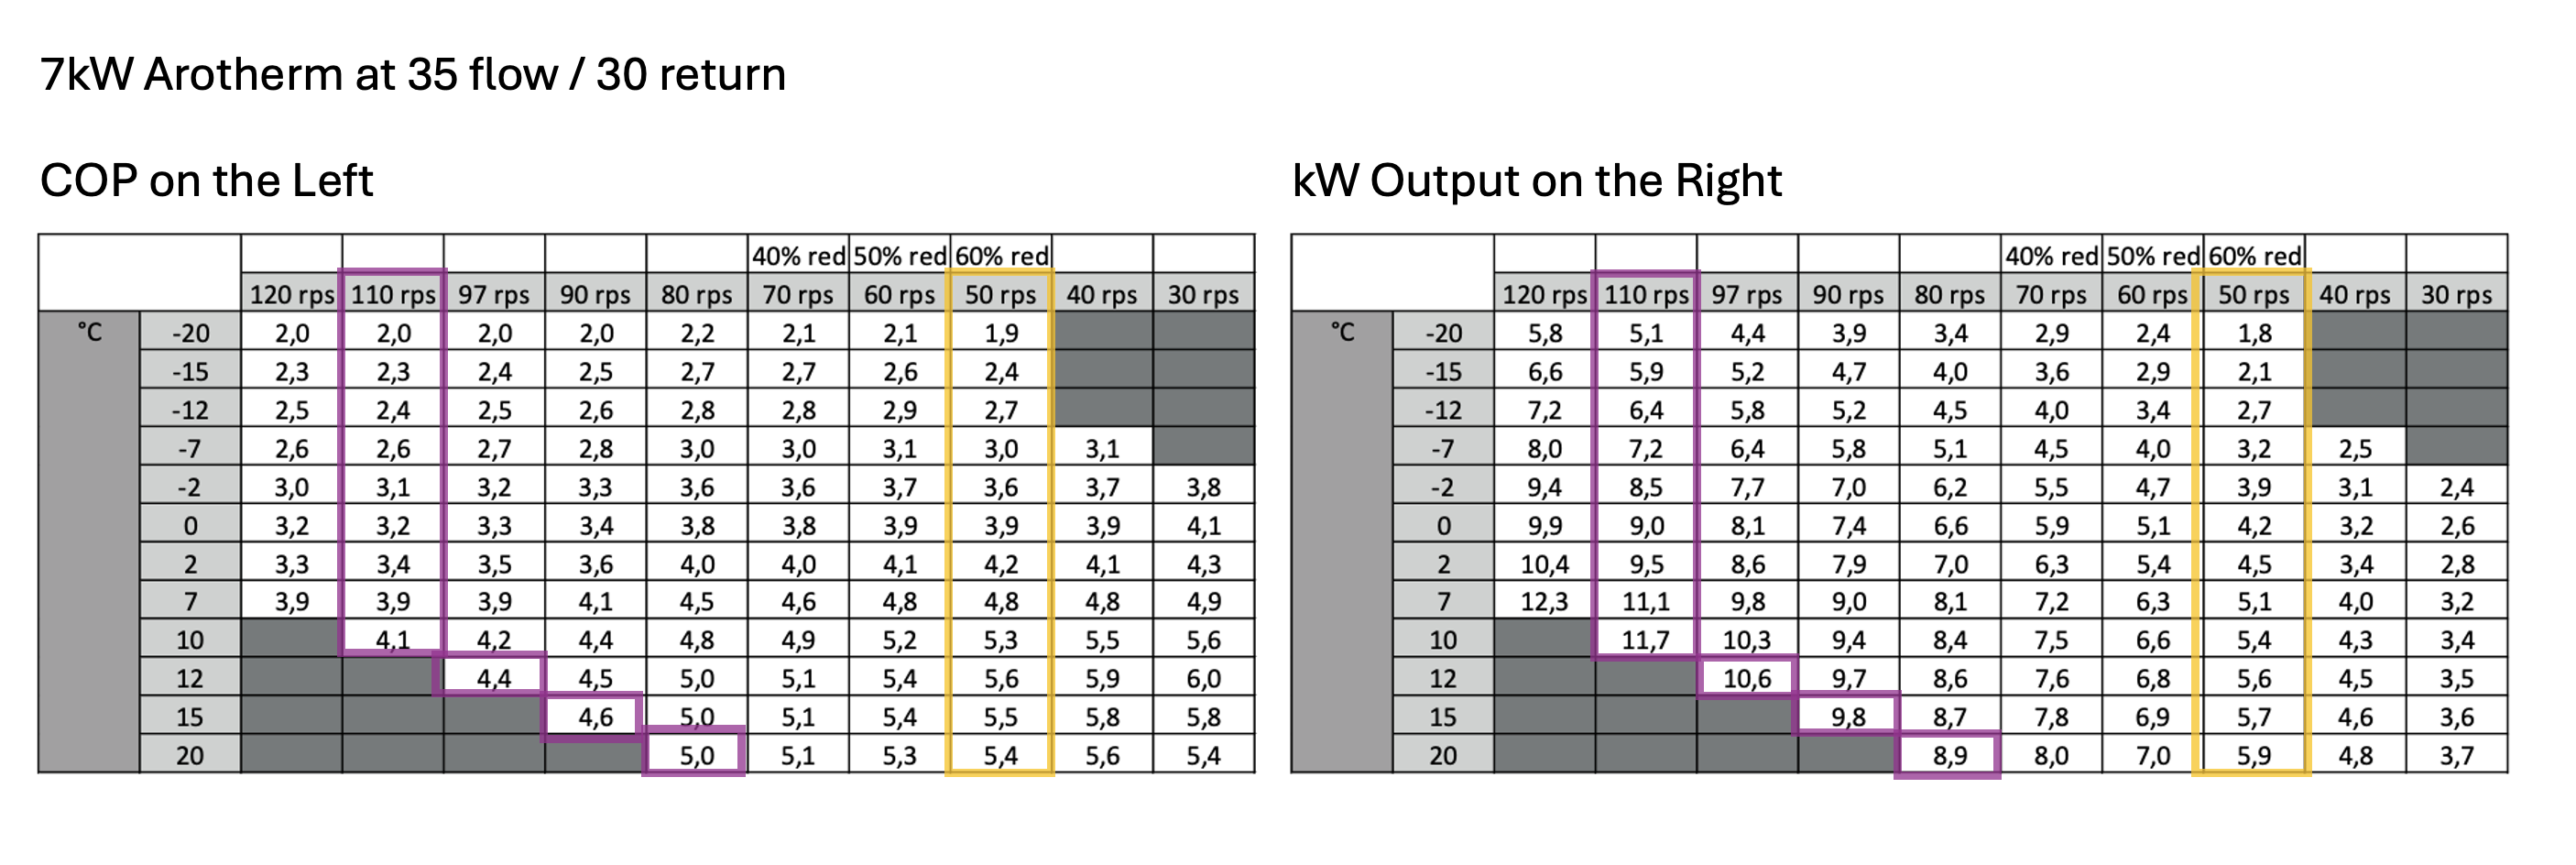
- Left hand table COP – Yellow is Eco (50 rps) and Purple is Normal (110rps)
- Right hand table kW output – Yellow is Eco (50 rps) and Purple is Normal (110rps)
You can clearly see the COP is higher in Eco, but the kW output is lower. So you have a trade off to consider.
And whilst we are only showing the table for 35 flow, 30 return here. This difference in COP mismatch (Normal versus Eco) continues throughout the temperature range ; the tables showing 45/40, 55/47 etc.
Czech Tables versus Real World (Hot Water)
As we showed earlier, it is absolutely possible to hit the numbers from the Czech charts during heating. But my investigations show it is proving much harder, almost impossible to do this during hot water runs.
When heating a whole house you have a full heating circuit made up of radiators and/or underfloor heating along with all the interconnecting pipework.
The amount of water circulating within all that and the amount of surface area where you can shed the heat produced via the heat pump is way more than the size of a coil in a cylinder or any plate heat exchanger.
It’s like there is a lack of surface area available to shed the heat in a hot water cylinder.
Both myself with my 250L Mixergy cylinder and Szymon (Urban Plumbers) with his 200L Heat Geek Newark cylinder have really pushed our 5kW Arotherm to their limits through the summer of 2024.
Firstly, let’s look at a summarised table I created showing COP and kW output from the Czech tables.
These condensed tables are only for 50 rps compressor, i.e. Eco mode on a 5kW model at 35C, 45C and 55C flow temperatures.
5kW Arotherm COP (left) and kW Output (right)
| COP | 35C | 45C | 55C | kW Output | 35C | 45C | 55C | |
| -2C | 3.4 | 2.7 | 2.2 | -2C | 2.7 | 2.5 | 2.3 | |
| 0C | 3.6 | 2.9 | 2.3 | 0C | 2.9 | 2.7 | 2.5 | |
| 2C | 3.7 | 3.0 | 2.5 | 2C | 3.0 | 2.8 | 2.7 | |
| 7C | 4.3 | 3.3 | 2.5 | 7C | 3.7 | 3.1 | 2.8 | |
| 10C | 4.7 | 3.7 | 2.7 | 10C | 3.9 | 3.6 | 3.1 | |
| 12C | 5.1 | 3.7 | 2.8 | 12C | 4.0 | 3.8 | 3.3 | |
| 15C | 5.8 | 4.1 | 3.0 | 15C | 4.2 | 3.9 | 3.5 | |
| 20C | 7.0 | 4.7 | 3.1 | 20C | 4.5 | 4.1 | 3.7 |
What I have found over the past few months is that in Eco mode you can hit almost all the COP / kW combinations up to 12C outside.
The 15C outside numbers are borderline manageable.
But it is impossible to get close to the 20C outside COP targets from the charts.
It’s like there is a hard limit of performance on hot water once you get above around 15C outside.
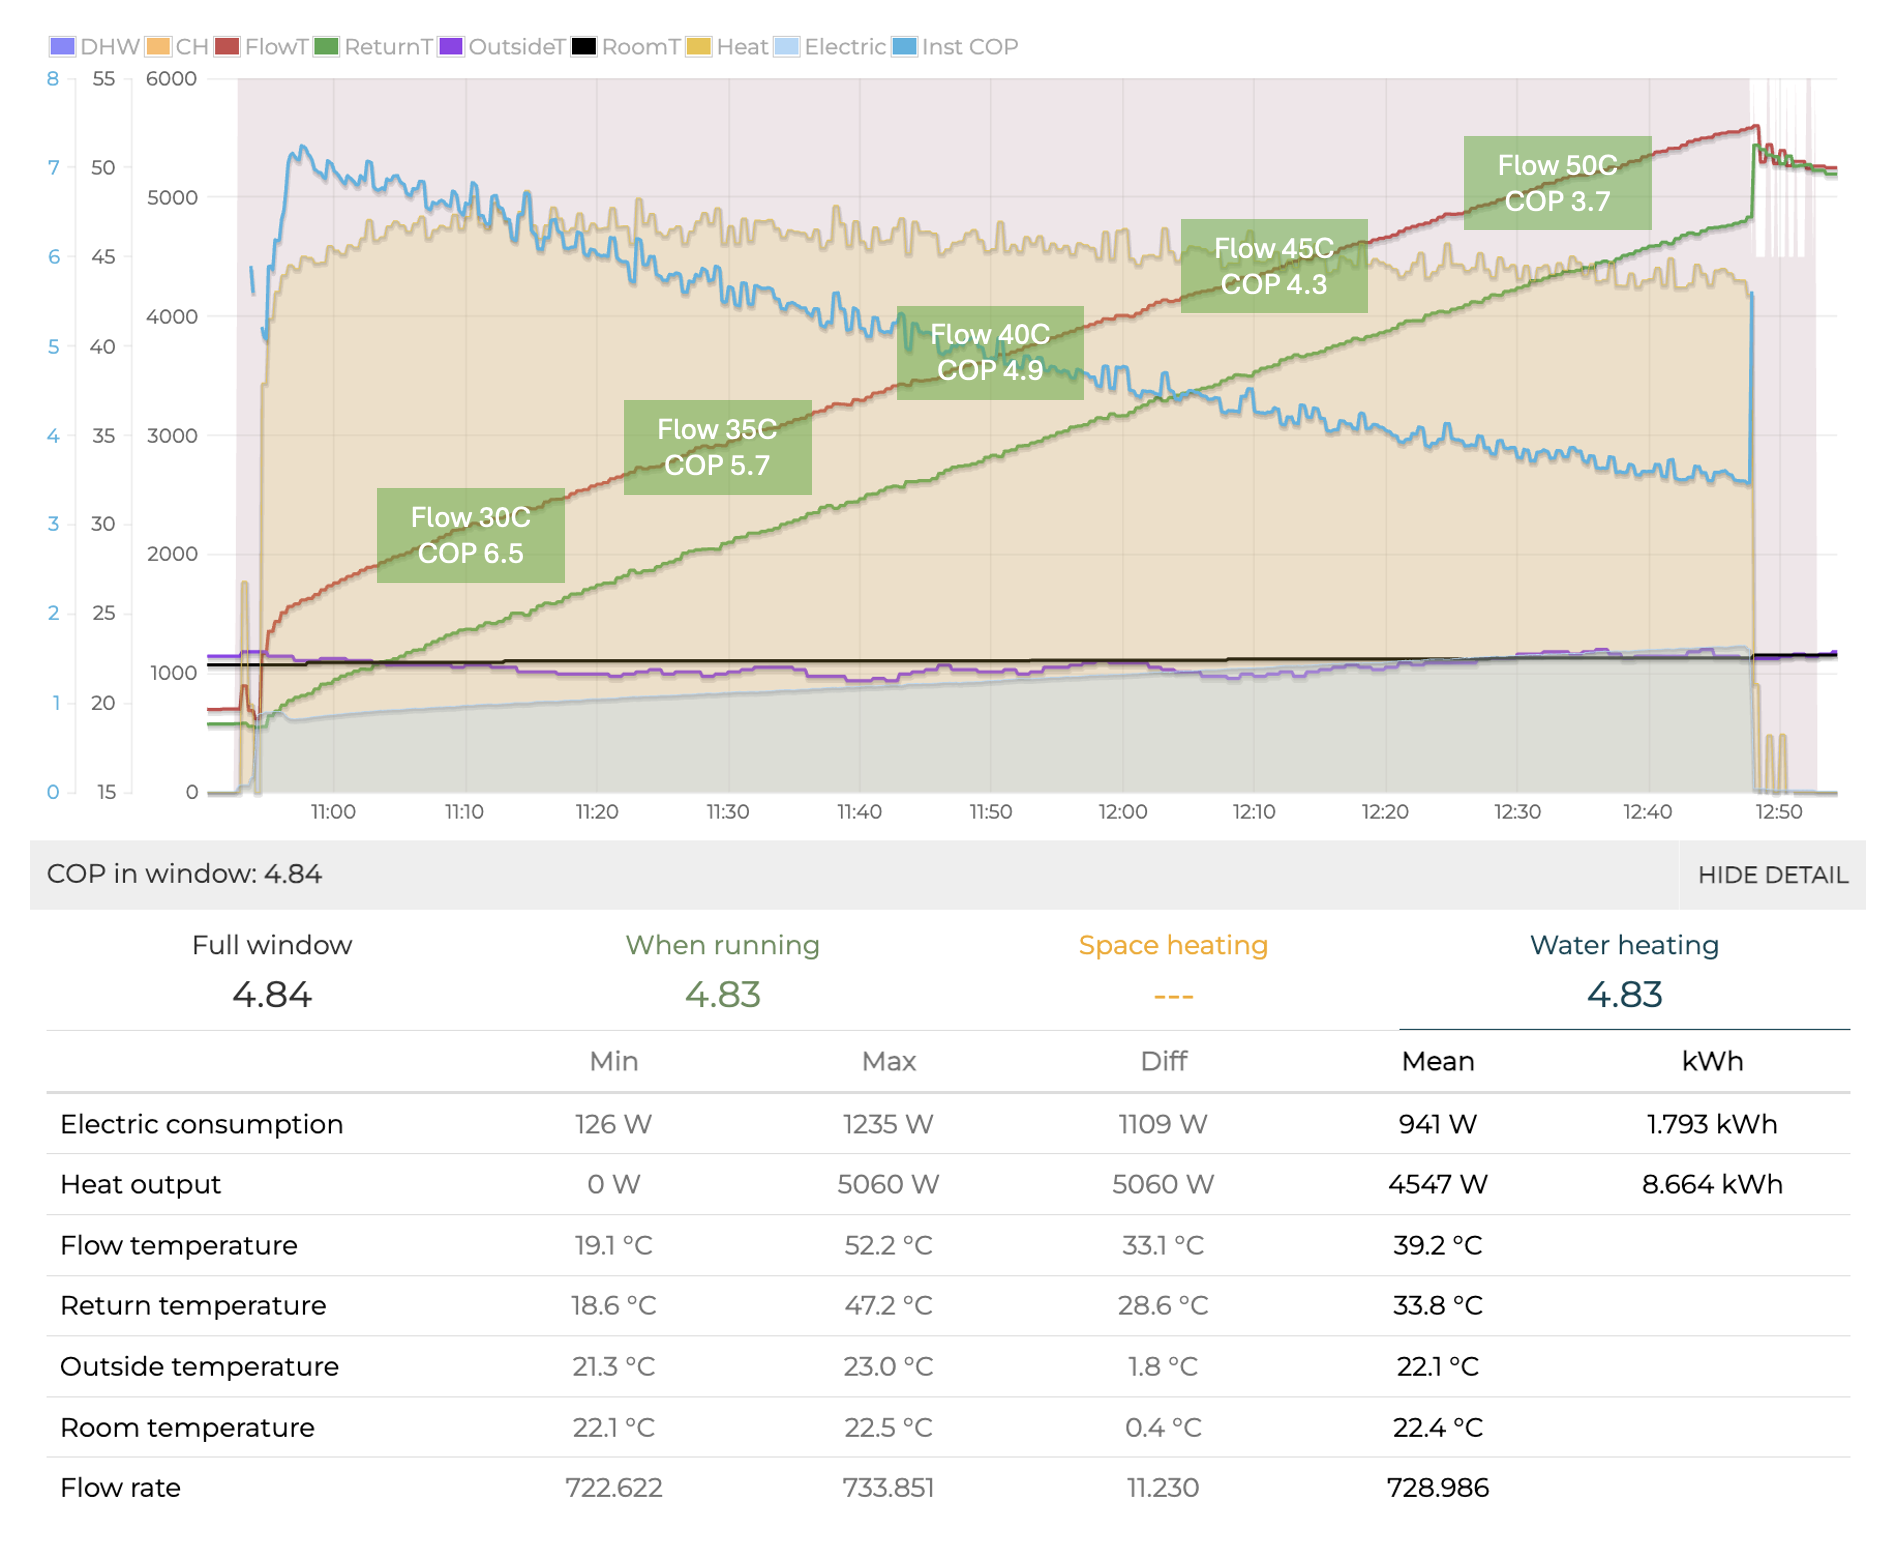
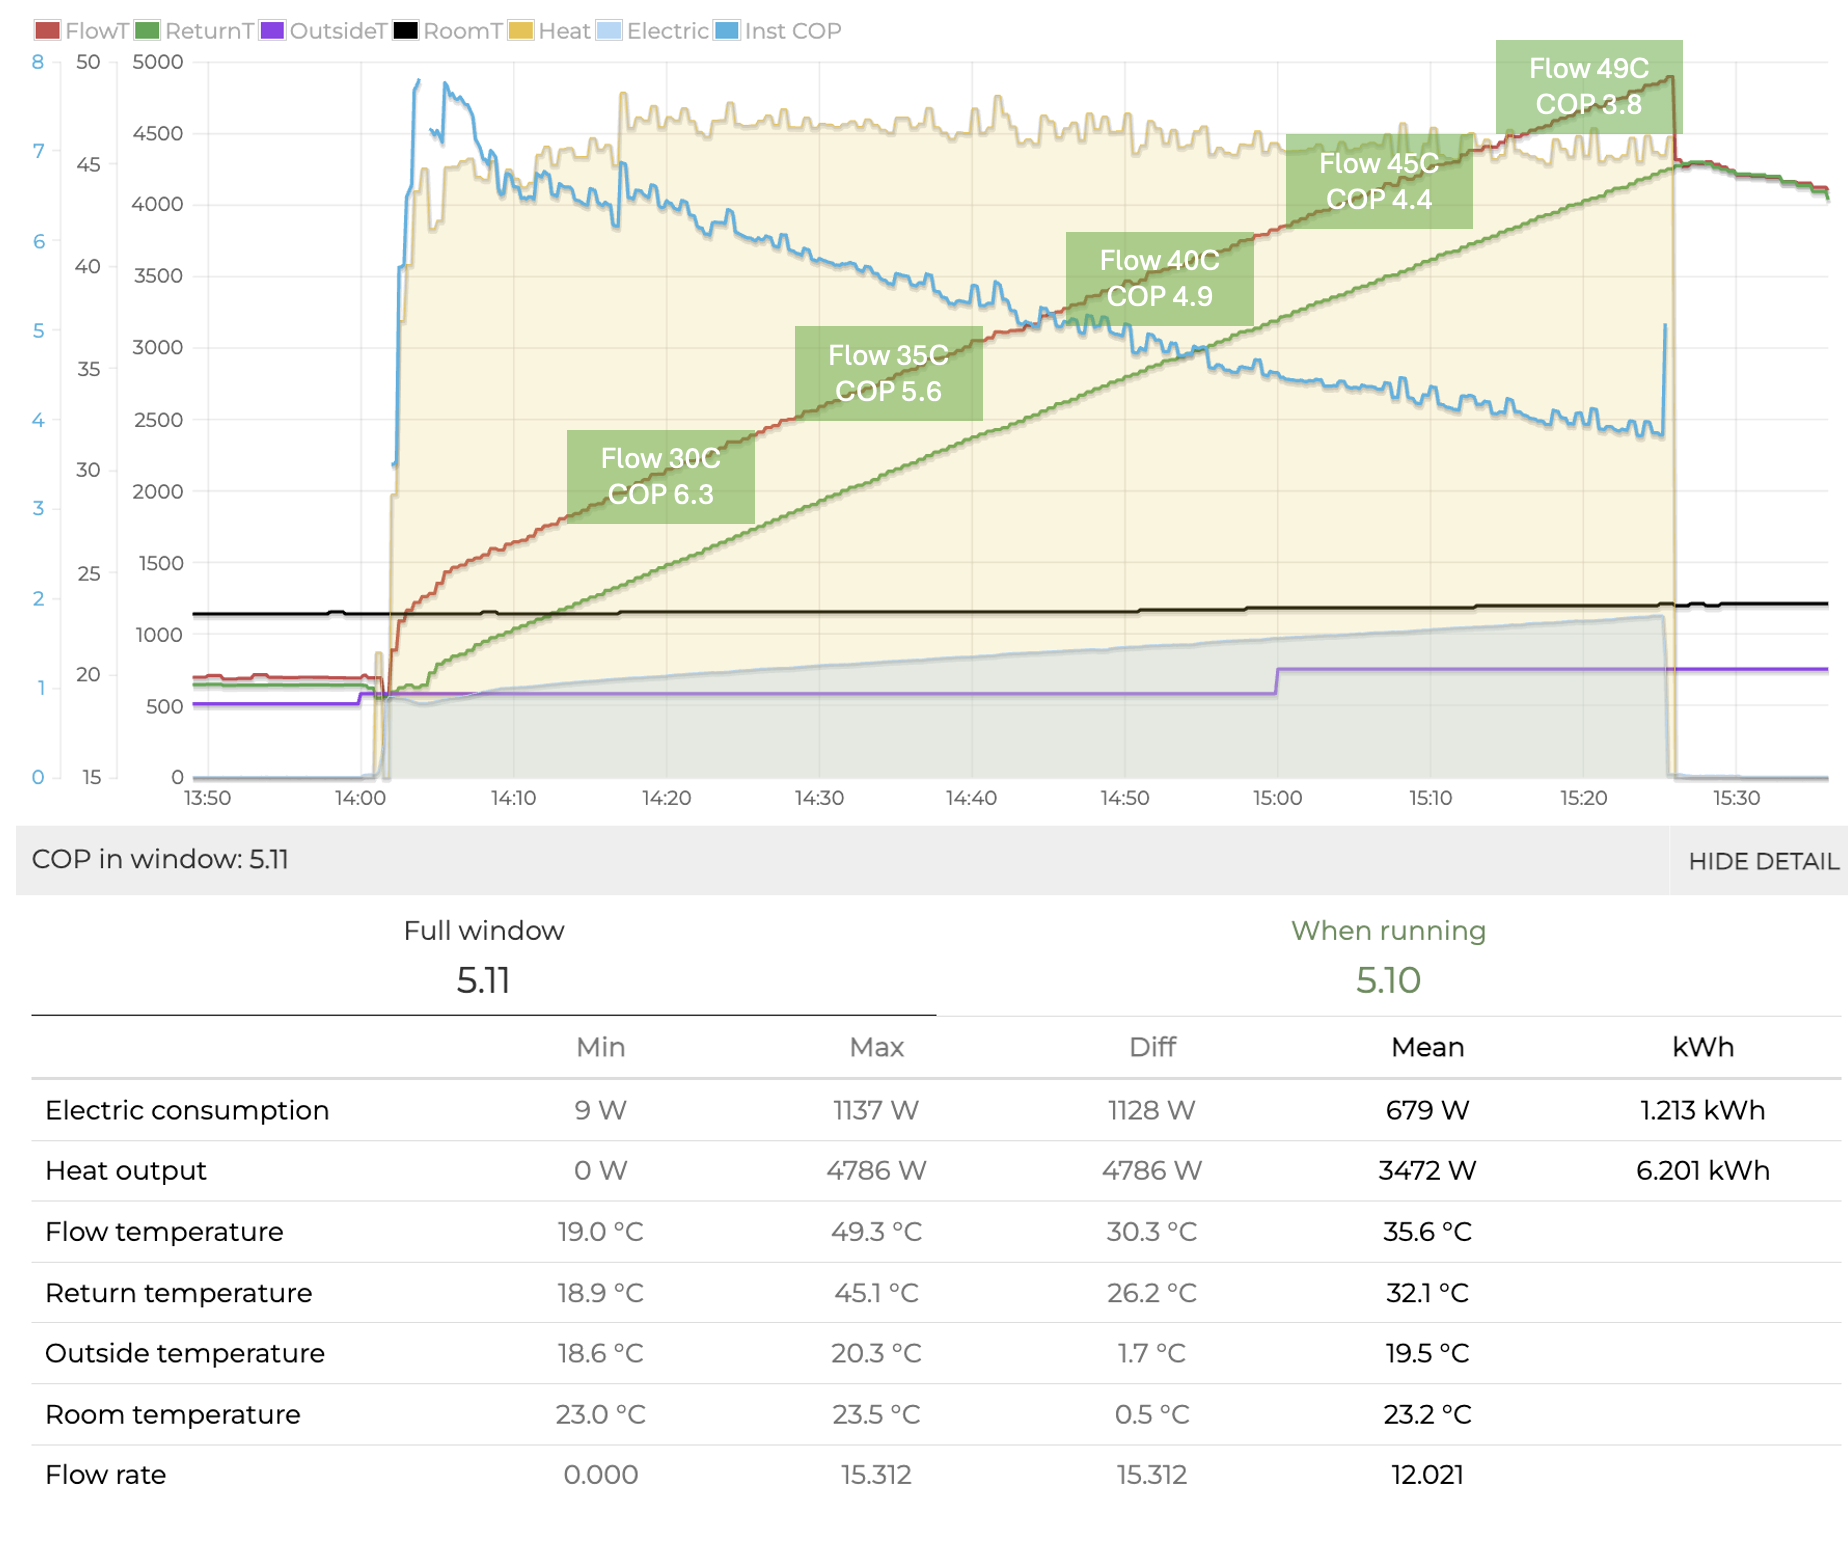
Here are two ‘best in class’ hot water run examples from my Mixergy and Szymon’s Heat Geek Newark super cylinder. Both runs are done in Eco mode.
The ‘Instantaneous COP’ is a magnificent feature of Open Energy Monitor (the blue trace line) showing COP all the way through the run.
I have added indicator boxes to show instantaneous COP at 30C, 35C, 40C, 45C and 50C flow temperatures across both runs.
Mick 24th July (22C outside), https://emoncms.org/energystatsuk?mode=power&start=1721814620&end=1721822060&cop=1
When I compiled these graphs from the two 5kW models I was convinced I would then find that 7kW and 10kW / 12kW version would produce better hot water performance than 5kW models, just like they do in heating mode.
I had some willing volunteers do similar hot water runs to replicate the runs the both Szymon and I had run above.
Many thanks to those people for helping me with this article.
So these hot water runs were from an empty cylinder/fully cold, at around 20C outside and to a whole cylinder target of around 45C to 48C.
Here are the runs and here are the compiled results in chart format
Adam – 7kW Arotherm (21C outside)
Andrew – 12kW Arotherm (18.5C outside)
Tim – 5kW Arotherm (19.7C outside)
Rob – 10kW Viessmann (19.7C outside) – not quite “from cold”
Here is a summary of the setups
- Mick – 5kW Vaillant with 250L Mixergy Cylinder
- Szymon – 5kW Vaillant with 200L Newark Heat Geek Cylinder
- Tim – 5kW Vaillant with 250L Vaillant Cylinder
- Adam – 7kW Vaillant with 250L Newark Heat Geek Cylinder
- Rob – 10kW Viessmann with 200L OSO Delta Cylinder
- Andrew – 12kW Vaillant with 250L Newark Heat Geek Cylinder
And a table showing the COP are 30C, 35C, 40C, 45C and 50C.
| Mick 5kW Vaillant | Szymon 5kW Vaillant | Tim 5kW Vaillant | Adam 7kW Vaillant | Rob 10kW Viessman | Andrew 12kW Vaillant | |
| 30C Flow COP | 6.5 | 6.3 | 6.3 | 6.5 | n/a | 6.7 |
| 35C Flow COP | 5.7 | 5.6 | 5.6 | 5.7 | 5.8 | 5.7 |
| 40C Flow COP | 4.9 | 4.9 | 4.9 | 4.8 | 5.3 | 5.1 |
| 45C Flow COP | 4.3 | 4.4 | 4.2 | 4.3 | 4.5 | 4.4 |
| 50C Flow COP | 3.7 | 3.8 | 3.8 | 3.7 | 3.8 | 3.9 |
So what do we see here?
It seems to me that regardless of heat pump size and also cylinder model, there is a performance ceiling on hot water runs when around 20C outside.
- Is this a limitation of the heat pump?
- Is it a limitation of the cylinder?
- Are we just testing the heat pumps here?
To be honest, I don’t know and to be honest, I’m not too bothered at this stage.
I initially set out to prove that bigger heat pumps would perform better than smaller ones. I had done that on heating and fully expected that to carry over to hot water as well.
But this investigation finds the total opposite.
There appears to be NO DIFFERENCE in performance between 5kW, 7kW or 10kW / 12kW Arotherm models, across a variety of cylinders; Mixergy, Heat Geek, Vaiilant and OSO, when around 20C outside.
I’m thinking this might need another full round of testing at under the 15C outside temperature marker.
I’m wondering whether an across the board 10C outside “from cold” hot water test could well be the order of the day?
Maybe that’s an article for another day?
Hot Water in Summary
- No apparent difference in hot water performance between the 5kW, 7kW and 10/12kW models when above 15C outside.
- Most cylinders seem to be hitting a performance ceiling at around 15C outside and above.
- Only minor improvements are seen when outside temperatures go beyond 25C.
- Choose Eco mode on the Vaillant if you want performance (slower recharges)
- Choose Normal mode if you prefer speed of recharge (lower performance)
- The lower your target cylinder temperature, the higher the performance numbers (COP) you will see.
- Start your hot water runs with your tank as close to empty/cold as you can if you are chasing performance.
- Schedule your runs for 2pm rather than 2am if you want best COP (higher outside temperature equals better performance).
- Schedule your runs for 2am if you are on a cheap overnight and if cost matters more than COP.
For more in-depth hot water analysis, take a look at this article where I compared the performance of my 5kW Arotherm and Mixergy combination versus a 7kW Arotherm and Heat Geek Newark cylinder.
You can see the detailed analysis I did on that here; Mixergy Heat Pump Performance.
There is also a big Eco versus Normal shoot-out in that article for those that want to see the difference.
Eco Hot Water Mode Quick Tables
Here are some quick tables where I have transposed the COP and kW output details about Eco hot water mode on the 5kW, 7kW and 10/12kW models.
You can use these quick reference tables to see how close your own Eco hot water runs are to the Czech tables.
5kW, Eco Mode, 50 rps
| COP | 35C | 45C | 55C | kW Output | 35C | 45C | 55C | |
| -2C | 3.4 | 2.7 | 2.2 | -2C | 2.7 | 2.5 | 2.3 | |
| 0C | 3.6 | 2.9 | 2.3 | 0C | 2.9 | 2.7 | 2.5 | |
| 2C | 3.7 | 3.0 | 2.5 | 2C | 3.0 | 2.8 | 2.7 | |
| 7C | 4.3 | 3.3 | 2.5 | 7C | 3.7 | 3.1 | 2.8 | |
| 10C | 4.7 | 3.7 | 2.7 | 10C | 3.9 | 3.6 | 3.1 | |
| 12C | 5.1 | 3.7 | 2.8 | 12C | 4.0 | 3.8 | 3.3 | |
| 15C | 5.8 | 4.1 | 3.0 | 15C | 4.2 | 3.9 | 3.5 | |
| 20C | 7.0 | 4.7 | 3.1 | 20C | 4.5 | 4.1 | 3.7 |
7kW, Eco Mode, 50 rps
| COP | 35C | 45C | 55C | kW Output | 35C | 45C | 55C | |
| -2C | 3.6 | 2.8 | 2.3 | -2C | 3.9 | 3.3 | 3.2 | |
| 0C | 3.9 | 3.0 | 2.5 | 0C | 4.2 | 3.6 | 3.5 | |
| 2C | 4.2 | 3.2 | 2.6 | 2C | 4.5 | 3.9 | 3.7 | |
| 7C | 4.8 | 3.7 | 3.0 | 7C | 5.1 | 4.6 | 4.3 | |
| 10C | 5.3 | 3.9 | 3.0 | 10C | 5.4 | 4.9 | 4.6 | |
| 12C | 5.6 | 3.9 | 3.1 | 12C | 5.6 | 5.1 | 4.8 | |
| 15C | 5.5 | 4.2 | 3.3 | 15C | 5.7 | 5.6 | 5.3 | |
| 20C | 5.4 | 4.2 | 3.3 | 20C | 5.9 | 5.7 | 5.5 |
10kW / 12kW, Eco Mode, 40 rps
| COP | 35C | 45C | 55C | kW Output | 35C | 45C | 55C | |
| -2C | 4.2 | 3.2 | 2.4 | -2C | 5.7 | 5.4 | 5.0 | |
| 0C | 4.4 | 3.5 | 2.6 | 0C | 6.2 | 6.0 | 5.5 | |
| 2C | 4.7 | 3.8 | 2.9 | 2C | 6.7 | 6.6 | 6.0 | |
| 7C | 5.5 | 4.2 | 3.0 | 7C | 7.8 | 7.5 | 6.3 | |
| 10C | 5.9 | 4.4 | 3.3 | 10C | 8.2 | 7.9 | 7.1 | |
| 12C | 6.1 | 4.6 | 3.6 | 12C | 8.5 | 8.2 | 7.6 | |
| 15C | 6.4 | 4.6 | 3.6 | 15C | 8.5 | 8.3 | 7.7 | |
| 20C | 6.9 | 4.6 | 3.7 | 20C | 8.6 | 8.4 | 7.9 |
How long does it take to heat the water?
I have posted this chart many times on different blog posts, but it is always useful when talking about hot water.
You can get a sense from this chart the trade off in time versus performance in Eco and Normal modes.
Here’s some ballpark Eco mode and Normal mode outputs from each of the models
- 5kW (Eco 3kW to 4kW, Normal 6kW to 7kW)
- 7kW (Eco 4kW to 5kW, Normal 8kW to 9kW)
- 10kW (Eco 6kW to 8kW, Normal 12kW to 14kW)
- 12kW (Eco 6kW to 8kW, Normal 14kW to 16kW)
Time in minutes to heat water (from 10C to 50C) using various power output sizes
| 3kW | 5kW | 7kW | 10kW | 12kW | 14kW | 16kW | |
| 50L | 47 | 28 | 20 | 14 | 12 | 10 | 9 |
| 100L | 94 | 56 | 40 | 28 | 24 | 20 | 18 |
| 150L | 140 | 84 | 60 | 42 | 36 | 30 | 27 |
| 200L | 187 | 112 | 80 | 56 | 48 | 40 | 36 |
| 250L | 233 | 140 | 100 | 70 | 60 | 50 | 45 |
| 300L | 280 | 168 | 120 | 84 | 72 | 60 | 54 |
You can create your own using this very handy online water heating calculator.
Summary and Round Up
So here’s TL;DR (too long, didn’t read) of today’s whole article.
The underlying technical data shows that larger output heat pumps will always win the performance race under the same circumstances (flow temp and outside temperature at the same compressor speed) than smaller ones when heating.
But on the evidence of the hot water data I collected when 20C outside, all the different sized heat pumps perform the same (subject to a further round of testing at 10C outside).
This investigation would also suggest that the combination of a large model heat pump and low hot water percentage usage will likely yield the best overall performance. Hot water performance is always going to be lower than heating performance, so the less water you have to produce, the less you’ll drag down your overall performance numbers/averages.
Looking at the Top of the SCOP charts on https://heatpumpmonitor.org I don’t think this “size” phenomenon is limited to Vaillant models as there are larger Viessman and Nibe up there too.
Note: this article is only talking about air source heat pumps (air to water). I’ve not considered the ground source ones that are up on the charts. There are only a small number at the moment and they are normally on the larger size by nature.
So to all 5kW heat pump owners, I’m sad to report, I don’t think we will ever be Top of the SCOPS.
It’s almost like we need our own subset table within the main table!! LOL. Or a little filter button for different heat pump sizes.
I’m sort of at peace with this now though. Mainly because I can understand why it’s happening.
But let’s not finish on a sour note. As I said right at the start of the article, my 5kW unit managed a 6 month winter combined SCOP of over 4.0 in a 1930s semi detached house with a family of 4 using a lot of hot water. So it is still a fantastic heat pump and great things can be achieved. The house is way more comfortable and running costs are cheaper than a gas boiler.
And when coupled with solar, batteries, and time of use tariffs, even better things happen for running costs, as shown in this 2023 running costs article.
We are so happy we are now a gas free house.
Goodbye Gas Meter
There is the final technical question though…..why is there a difference?
My personal thought is that a compressor and all the internal workings within the external unit of the heat pump takes a certain amount of electricity to run.
And regardless of which size heat pump you have, that certain amount of electricity is almost the same across the board. But it’s a bigger proportion of the overall energy required for a smaller heat pump.
So because the amount of energy/heat (kW) the bigger units can generate is higher, the difference between the base electricity requirement and that energy/heat generated is greater.
It’s almost like the bigger units have got more room to breathe? For want of a better expression?
It could also be that Vaillant 10/12kW units use a different type of compressor to their smaller siblings? The larger models use a “scroll” compressor. Scroll compressors are more efficient (according to chatGPT). As far as I can deduce, the 5kW and the 7kW use rotary compressors?
Adam Chapman, of Heat Geek fame, suggested that some of the issues could be because of the UK planning insistence that we cram all the gubbins of the single fan heat pump into a 0.6 cubic metre box.
The 3.5kW, 5kW and 7kW are single fan units with the 10kW and 12kW being double fan units that need planning permission.
If we were allowed bigger boxes for our smaller heat pumps, perhaps we’d be able to get more performance out of them?
Those are just a few little theories and thoughts, what are yours?
Referral information and free credit offer
If you find Energy Stats UK useful, there are a couple of easy ways to support the site and help cover hosting and server costs.
Thinking about switching energy suppliers?
Homeowners who join Octopus Energy using my referral link get £50 free credit after signing up. Business users get £100 free credit, and if you’re looking at solar or a heat pump, there’s also a £100 gift card through Octopus Tech.
Or, if you just want to say thanks, you can buy me a coffee.
You can also see more ways to support the site here via the likes of Plusnet broadband, Smarty Mobile, Havenwise remote heat pump control, Hetzner Cloud hosting and more.
Follow @energystatsuk on Twitter / X, Bluesky and Mastodon for daily tariff graphs and updates.
Note: The current and past performance of energy pricing is not necessarily a guide to the future.


2 Comments