How to View Vaillant aroTHERM Live Data
This guide shows how to view Vaillant aroTHERM live data using the VWZ AI controller. It covers where to find flow and return temperatures, power use, compressor behaviour, and installer-level diagnostics, so you can see what your heat pump is actually doing in real time.
We also look at how this compares to other ways of viewing heat pump data, including Home Assistant via the myVAILLANT API, Open Energy Monitor with a heat meter, and third-party eBUS readers. Each approach offers a different level of detail, accuracy, and complexity, and this guide helps set expectations about what each one can and can’t show.
The guide also explains how to interpret the different messages shown on the controller, including live status codes, maintenance messages, and fault codes. It shows where each one appears on the VWZ AI interface and how to tell the difference between normal operating states, warnings that need attention, and faults that stop or restrict operation.

Table of Contents
Use the Table of Contents below to jump straight to the section that matters most or scroll through at your own pace.
This article is part of my wider series of Vaillant Arotherm guides, aiming to demystify the settings that matter most for efficiency and comfort.
Vaillant Arotherm Heat Pump Guide & User Manual
Introducing the VWZ AI controller
Every Vaillant aroTHERM installation includes a VWZ AI controller. This is the white box usually mounted near the cylinder or wiring centre.
You may also have:
-
A sensoCOMFORT indoor controller
-
The myVaillant app
Both are useful, but neither exposes much technical detail. The VWZ AI does. It shows live temperatures, power draw, compressor behaviour and system status if you know where to look.

VWZ AI controller user guide
For convenience, I have uploaded the VWZ AI controller user guide up onto the site for easy access.
You can grab it via this link: VWZ AI Controller User Guide.
Opening the top-level menu
To access the main menu:
-
Press the top two buttons at the same time
-
The top-level menu appears
Top-level menu structure
-
Yield Indicator
-
Live Monitor
-
Information
-
Basic Settings
-
Resets
-
Installer Level
Yield Indicator menu
Menu path
-
Menu
-
Yield Indicator
-
This menu shows estimated energy totals for heating, hot water and cooling. It also includes “working figures”, which are the controller’s own COP calculations.
I cover how these are calculated and what they’re good for in How to Measure Vaillant aroTHERM COP:
Fields available
Use the + and − buttons to scroll:
-
Energy yield: Day, Heating (kWh)
-
Energy yield: Day, Domestic hot water (kWh)
-
Energy yield: Day, Cooling (kWh)
-
Energy yield: Month, Heating (kWh)
-
Working figure: Month, Heating
-
Energy yield: Total, Heating (kWh)
-
Working figure: Total, Heating
-
Energy yield: Month, Cooling (kWh)
-
SEER, month, cooling
-
Energy yield: Total, Cooling (kWh)
-
SEER, total, cooling
-
Energy yield: Month, Domestic hot water (kWh)
-
Working figure: Month, Domestic hot water
-
Energy yield: Total, Domestic hot water (kWh)
-
Working figure: Total, Domestic hot water
-
Total energy consumption (kWh)
Note: All values are kWh unless marked as working figures or SEER.
Live Monitor menu
Menu path
-
Menu
-
Live Monitor
-
This menu, along with the Sensor / Actuator Test section are the most useful menus on the controller.
All values shown here are live and update while the system is running.
Fields available
-
Current status message(s)
-
Building circuit water pressure (bar)
-
Building circuit flow rate (l/h)
-
Compressor anti-cycling time (min)
-
Immersion heater anti-cycling time (min)
-
Target flow temperature (°C)
-
Current flow temperature (°C)
-
Energy integral (°min)
-
Cooling capacity (kW)
-
Electrical power consumption (kW)
-
Compressor modulation (%)
-
Air inlet temperature (°C)
-
Immersion heater power (kW)
-
Outdoor temperature (°C)
Note: Electrical power consumption is the heat pump and controller only, excluding any external components not connected and power through the controller.
Energy integral
The energy integral value plays a key role in deciding when the compressor starts and stops, and it’s often misunderstood. I’ve covered how it works, why it matters, and how it can cause unexpected behaviour in certain firmware versions in Vaillant aroTHERM Firmware 351.06.07 Energy Integral Problems.
Status codes and maintenance messages
Status codes, maintenance messages, and fault codes are shown in different places on the VWZ AI controller.
- Status codes appear in the Live Monitor and describe what the heat pump is doing right now.
- Maintenance messages appear on the main display as warnings or information messages and usually indicate conditions that need attention but do not immediately stop operation.
- Fault codes take priority over all other displays and are covered separately in the fault codes section.
VWZ AI maintenance messages
Maintenance messages warn that something needs attention, but the system will usually keep running.
| Message | What it means | What to check |
|---|---|---|
| Lhm.37 | Comfort protection mode | System running with reduced comfort after a detected fault |
| M32 | Low system pressure warning | Building circuit pressure in Live Monitor |
| Service symbol | Maintenance reminder | Service interval reached |
| Restricted mode | Output limited for protection | Live values and fault history |
VWZ AI status codes
Status codes appear in the Live Monitor and describe what the heat pump is doing at that moment. They are normal operating states, not errors.
| Status code | Description | What it usually means |
|---|---|---|
| S.00 | Standby | No current heating or hot water demand |
| S.01 | Heating mode | Space heating active |
| S.02 | Domestic hot water | Cylinder charging in progress |
| S.03 | Cooling mode | Cooling demand active |
| S.04 | Defrost mode | Outdoor unit defrosting |
| S.05 | Pump run-on | Pumps running after demand ends |
| S.06 | Anti-cycling delay | Compressor waiting before restart |
| S.07 | Energy balance active | Heat deficit being calculated |
| S.08 | Electric backup active | Immersion heater assisting |
| S.09 | Comfort protection | Output reduced to protect components |
Fault codes, which stop or restrict operation, are covered in the fault codes section below.
Information menu
Menu path
-
Menu
-
Information
-
This menu shows cumulative operating hours and basic system details.
Fields available
-
Contact details (phone number)
-
Serial number
-
Operating hours total (h)
-
Hours heating (h)
-
DHW operating hours (h)
-
Cooling operating hours (h)
Installer level menu
A note of caution
The installer level exposes useful diagnostic information, but it also allows changes that can materially affect how the system runs. Everything described below can be viewed safely. But tread carefully if you decide to change anything.
Accessing the installer level
-
Menu
-
Installer Level
-
-
Enter code 17
-
Press the select button
Installer level menu structure
-
Fault List
-
Test Menu
-
Statistics
-
Check Programmes
-
Sensor / Actuator Test
-
Configuration
-
Resets
-
Start Install Assistant
Installer fault list
Menu path
-
Installer Level
-
Fault List
-
This shows the last ten faults in chronological order, with:
-
Fault code (F.xx)
-
Plain-text description
Useful when diagnosing recurring or intermittent issues.
VWZ AI Fault Codes
Fault codes take priority over all other displays and may stop heating or hot water. If multiple faults occur, they are shown alternately.
| Fault code | Description | System behaviour | Common causes |
|---|---|---|---|
| F.22 | Low water pressure | Heat pump stops | System needs repressurising |
| F.723 | Building circuit pressure too low | Compressor shut down | Loss of system water |
| F.62 | Diverter valve fault | Heating or DHW unavailable | Valve or actuator issue |
| F.630 | Communication fault | Limited operation | eBUS wiring issue |
| F.655 | Compressor fault | Unit stopped | Protection triggered |
| F.731 | Sensor fault | Control limited | Faulty temperature sensor |
| F.732 | Outdoor sensor error | Weather compensation disabled | Sensor or wiring fault |
| F.785 | Flow temperature error | Heating disabled | Hydraulic or sensor issue |
Notes
-
A reset may restore operation temporarily.
-
Repeated fault codes point to an underlying issue.
-
Fault history can be viewed in the Installer Fault List menu.

Installer test menu
Menu path
-
Installer Level
-
Test Menu
-
Statistics
-
Compressor hours and starts
-
Building pump hours and starts
-
4-port valve hours and switching operations
-
Fan operating hours and starts
-
EEV steps
-
Switching operations count
These statistics can be useful to track what the heat pump is upto. For example, compressor hours and starts can be useful to track cycling as described in this article: Heat Pump Cycling and Minimum Modulation.
Check programmes
-
P.04 Heating mode
-
P.06 Purge building circuit
-
P.12 De-icing
-
P.27 Immersion heater
-
P.29 High pressure
These are commissioning and diagnostic tools.
Sensor / actuator test
Menu path
-
Installer Level
-
Sensor / Actuator Test
-
This menu exposes detailed live readings and allows manual actuation of components. In a way, this menu contains even better information than the live monitor. Think of the sensor test list as live monitor 2.0
Knowing the flow temperature, return temperature, and flow rate together is particularly useful. These three values are the key inputs for calculating mass flow rate, which tells you how much heat energy is actually being moved around the system at any moment. This is explained in detail in Understanding Mass Flow Rate in Heat Pump Systems.
Sensor / actuator reference table
| ID | Name | Min | Max | Unit | Increment | Factory setting |
|---|---|---|---|---|---|---|
| T.0.01 | Building circuit pump power | 0 | 100 | % | 5 | 0 |
| T.0.17 | Fan 1 | 0 | 100 | % | 5 | 0 |
| T.0.18 | Fan 2 | 0 | 100 | % | 5 | 0 |
| T.0.19 | Condensate tray heater | Off | On | – | – | Off |
| T.0.20 | 4-port valve | Off | On | – | – | Off |
| T.0.21 | EEV position | 0 | 100 | % | 5 | 0 |
| T.0.23 | Heating coil compressor | Off | On | – | – | Off |
| T.0.40 | Flow temperature | -40 | 90 | °C | 0.1 | – |
| T.0.41 | Return temperature | -40 | 90 | °C | 0.1 | – |
| T.0.42 | Building circuit water temperature | -40 | 90 | °C | 0.1 | – |
| T.0.43 | Building circuit flow rate | 0 | 4000 | l/h | 1 | – |
| T.0.48 | Air inlet temperature | -40 | 90 | °C | 0.1 | – |
| T.0.55 | Compressor outlet temperature | -40 | 135 | °C | 0.1 | – |
| T.0.56 | Compressor inlet temperature | -40 | 135 | °C | 0.1 | – |
| T.0.57 | EEV outlet temperature | -40 | 90 | °C | – | – |
| T.0.59 | Condenser outlet temperature | -40 | 90 | °C | 0.1 | – |
| T.0.63 | High pressure | 0 | 31.9 | bar (abs) | 0.1 | – |
| T.0.64 | Low pressure | 0 | 8 | bar (abs) | – | – |
| T.0.67 | High-pressure switch | Closed | Open | – | – | Closed |
| T.0.85 | Evaporation temperature | -40 | 90 | °C | 0.1 | – |
| T.0.86 | Condensation temperature | -40 | 70 | °C | 0.1 | – |
| T.0.87 | Superheat target value | -40 | 90 | K | 0.1 | – |
| T.0.88 | Superheat actual value | -40 | 90 | K | 0.1 | – |
| T.0.89 | Subcooling target value | -40 | 90 | K | 0.1 | – |
| T.0.90 | Subcooling actual value | -40 | 90 | K | 0.1 | – |
| T.0.93 | Compressor speed | 0 | 120 | rotations/s | 1 | – |
| T.0.123 | Temperature switch: compressor outlet | Open | Closed | – | – | Open |
| T.1.02 | DHW prioritising diverter valve | Heating | Domestic hot water | – | – | Heating |
| T.1.44 | Cylinder temperature | -40 | 90 | °C | 0.1 | – |
| T.1.46 | Lockout contact S20 | Closed | Open | – | – | Closed |
| T.1.69 | Outdoor temperature | -40 | 90 | °C | 0.1 | – |
| T.1.70 | System temperature | -40 | 90 | °C | 0.1 | – |
| T.1.71 | DCF status | No signal | Valid signal | – | – | No DCF signal |
| T.1.72 | Lockout contact S21 | Closed | Open | – | – | Open |
| T.1.119 | MO1 output | Off | On | – | – | Off |
| T.1.125 | MPI input | – | – | – | – | – |
| T.1.126 | MO2 output | Off | On | – | – | Off |
Installer configuration menu
Menu path
-
Installer Level
-
Configuration
-
This menu contains the core system parameters that control how the heat pump behaves, including pump speed configuration and hot water behaviour.
One of the options here is DHW mode, which controls how the heat pump prioritises hot water production. This is covered in more detail in Vaillant aroTHERM Hot Water Modes Explained.
Compressor noise reduction
This setting limits compressor output to reduce noise, particularly during hot water production. It’s also the setting I used when developing Vaillant aroTHERM Sweet Spot Hot Water Mode, where compressor noise reduction is deliberately applied to balance noise, efficiency, and recovery time.
Configuration reference table
| ID | Name | Min | Max | Unit | Increment | Factory setting |
|---|---|---|---|---|---|---|
| T.0.01 | Building circuit pump power | 0 | 100 | % | 5 | 0 |
| T.0.17 | Fan 1 | 0 | 100 | % | 5 | 0 |
| T.0.18 | Fan 2 | 0 | 100 | % | 5 | 0 |
| T.0.19 | Condensate tray heater | Off | On | – | – | Off |
| T.0.20 | 4-port valve | Off | On | – | – | Off |
| T.0.21 | EEV position | 0 | 100 | % | 5 | 0 |
| T.0.23 | Heating coil compressor | Off | On | – | – | Off |
| T.0.40 | Flow temperature | -40 | 90 | °C | 0.1 | – |
| T.0.41 | Return temperature | -40 | 90 | °C | 0.1 | – |
| T.0.42 | Building circuit water temperature | -40 | 90 | °C | 0.1 | – |
| T.0.43 | Building circuit flow rate | 0 | 4000 | l/h | 1 | – |
| T.0.48 | Air inlet temperature | -40 | 90 | °C | 0.1 | – |
| T.0.55 | Compressor outlet temperature | -40 | 135 | °C | 0.1 | – |
| T.0.56 | Compressor inlet temperature | -40 | 135 | °C | 0.1 | – |
| T.0.57 | EEV outlet temperature | -40 | 90 | °C | – | – |
| T.0.59 | Condenser outlet temperature | -40 | 90 | °C | 0.1 | – |
| T.0.63 | High pressure | 0 | 31.9 | bar (abs) | 0.1 | – |
| T.0.64 | Low pressure | 0 | 8 | bar (abs) | – | – |
| T.0.67 | High-pressure switch | Closed | Open | – | – | Closed |
| T.0.85 | Evaporation temperature | -40 | 90 | °C | 0.1 | – |
| T.0.86 | Condensation temperature | -40 | 70 | °C | 0.1 | – |
| T.0.87 | Superheat target value | -40 | 90 | K | 0.1 | – |
| T.0.88 | Superheat actual value | -40 | 90 | K | 0.1 | – |
| T.0.89 | Subcooling target value | -40 | 90 | K | 0.1 | – |
| T.0.90 | Subcooling actual value | -40 | 90 | K | 0.1 | – |
| T.0.93 | Compressor speed | 0 | 120 | rotations/s | 1 | – |
| T.0.123 | Temperature switch: compressor outlet | Open | Closed | – | – | Open |
| T.1.02 | DHW prioritising diverter valve | Heating | Domestic hot water | – | – | Heating |
| T.1.44 | Cylinder temperature | -40 | 90 | °C | 0.1 | – |
| T.1.46 | Lockout contact S20 | Closed | Open | – | – | Closed |
| T.1.69 | Outdoor temperature | -40 | 90 | °C | 0.1 | – |
| T.1.70 | System temperature | -40 | 90 | °C | 0.1 | – |
| T.1.71 | DCF status | No signal | Valid signal | – | – | No DCF signal |
| T.1.72 | Lockout contact S21 | Closed | Open | – | – | Open |
| T.1.119 | MO1 output | Off | On | – | – | Off |
| T.1.125 | MPI input | – | – | – | – | – |
| T.1.126 | MO2 output | Off | On | – | – | Off |
Installer resets menu
Menu path
-
Installer Level
-
Resets
-
This menu allows all parameters to be reset to factory defaults. Use with care.
Start install assistant
Menu path
-
Installer Level
-
Start Install Assistant
-
This launches the original commissioning assistant used during installation. Most users will never need to use it once the system is running normally.
VWZ AI controller video walkthrough
Here is a short video showing a complete walkthrough of every menu item on my own VWZ AI heat pump controller.
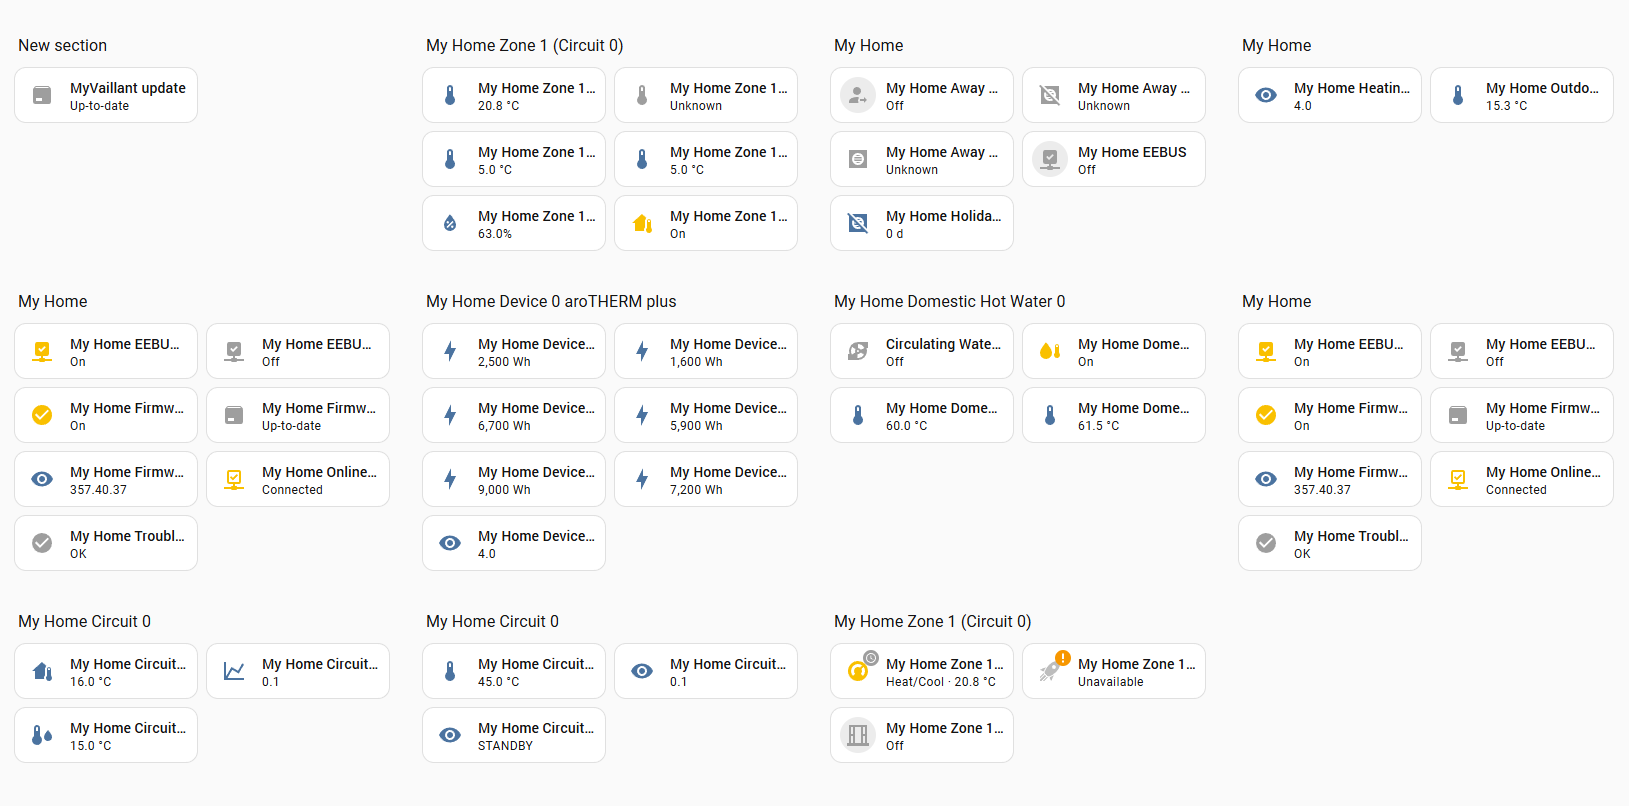
Tracking live data in Home Assistant
If you run Home Assistant, there is a myVAILLANT integration that connects to the Vaillant cloud API and pulls data into your own dashboards.
This uses the same backend as the myVaillant app, so it’s relatively easy to set up and doesn’t require any additional wiring or hardware.
What it’s good for
The integration gives you access to a small but useful set of values, such as:
-
Outdoor temperature
-
Current flow temperature
-
Heating curve and flow limits
-
Basic heating and hot water state
-
Energy and efficiency figures over time
Once the data is in Home Assistant, you can:
-
Build your own dashboards
-
Track trends over weeks or months
-
Combine heat pump data with weather, tariffs, or electricity meters
The trade-off
The downside is that the cloud API exposes far less data than the VWZ AI controller.
You won’t see:
-
Compressor speed or modulation
-
Energy integral
-
Instantaneous electrical power draw
-
Refrigerant pressures or temperatures
For understanding what the heat pump is doing in real time, the VWZ AI remains the most complete source.
Tracking live data with Open Energy Monitor
If you want the most accurate way to measure heat pump performance, a heat meter and electrical meter paired with Open Energy Monitor is the gold standard.
Unlike controller estimates or cloud data, this method measures real heat output and real electrical input directly. Data is typically logged every 10 seconds, which gives you everything needed to calculate both COP, SCOP and other metrics with confidence.
Why this approach matters
This setup measures:
-
Heat output using a calibrated heat meter
-
Electrical input using MID-approved electricity meters
-
Flow temperatures and flow rate at high resolution
That combination removes guesswork. You are no longer inferring performance from internal estimates or firmware calculations.
Space heating and hot water separated
One of the strengths of this setup is that space heating and hot water are tracked separately.
You can see:
-
Heat pump electrical consumption for space heating
-
Heat pump electrical consumption for hot water
-
Heat output for each mode
-
Separate COP values for heating and DHW
Clicking into each view breaks the figures out in more detail, which makes it much easier to understand where energy is actually going.
Typical live values you can see
A typical dashboard view includes:
-
Heat pump electrical consumption
-
Heat pump heat output
-
Flow temperature
-
Return temperature
-
Outside temperature
-
Room temperature
-
Target temperature
-
Flow rate
Because these values are logged continuously, you can review both live operation and historical behaviour over days, months, or entire heating seasons.
Public data and real systems
If you want to see how this looks in practice:
-
Live and historical data from my own system is published on emoncms (https://emoncms.org/energystatsuk)
-
You can also browse many other real-world installations on the HeatPumpMonitor.org website along with hundreds of other heat pumps.
Seeing multiple systems side by side is useful for context, especially when comparing flow temperatures, weather conditions, and seasonal performance.
Accuracy and limitations
This setup uses billing-grade, MID-approved meters, which makes it about as close as you’ll get to a gold standard for domestic heat pump monitoring.
The main downsides are:
-
Additional hardware cost
-
Installation complexity
-
Physical access needed for meters and sensors
But if your goal is accurate COP and SCOP rather than estimates, this is the benchmark everything else is measured against.
Downside versus VWZ AI controller
The VWZ AI controller can still give details you can’t get from Open Energy Monitor like compressor speed and under the hood Vaillant specific metrics like energy integral.
Example screenshot from Open Energy Monitor

eBUS adapter and ebusd software
Since we’ve already looked at Home Assistant and the myVAILLANT integration, it’s worth briefly noting that there is also a third-party way to access Vaillant data directly from the eBUS.
One example is ebusd, an open-source software project that connects to the Vaillant eBUS using a dedicated USB or serial hardware adapter.
This section is for awareness only. It is not a recommendation.
What ebusd can do
-
Read a very large amount of data directly from the heat pump via eBUS
-
Community-maintained configuration files exist to decode many VWZ AI values
-
Data can be published to MQTT
-
MQTT data can then be pulled into Home Assistant or other systems
-
It is also possible to write values back to the VWZ AI via eBUS
In terms of raw visibility, this goes far beyond what the myVAILLANT cloud API exposes.
Important downsides to be aware of
There are some serious caveats:
-
Connecting unsupported third-party hardware to the Vaillant eBUS is highly likely to void your Vaillant warranty
-
Both the ebusd software and the eBUS adapters are aimed at experienced technical users
-
Installation and configuration are non-trivial
-
This is not a “next, next, finish” setup and can be frustrating to get working
How this fits with the rest of this guide
For most users:
-
The VWZ AI controller remains the safest and most complete source of Vaillant Arotherm live data
-
Home Assistant via myVAILLANT works well for dashboards (albeit with limited data fields)
- Open Energy Monitor is the gold standard for accuracy and long term tracking
ebusd sits firmly in the advanced tinkering category. It exists, it’s powerful, but it carries risks and complexity that should be fully understood before experimenting.
Referral information and free credit offer
If you find Energy Stats UK useful, there are a couple of easy ways to support the site and help cover hosting and server costs.
Thinking about switching energy suppliers?
Homeowners who join Octopus Energy using my referral link get £50 free credit after signing up. Business users get £100 free credit, and if you’re looking at solar or a heat pump, there’s also a £100 gift card through Octopus Tech.
Finally, a £25 gift card can be claimed when having an EV charger installed through Octopus.
“Existing Octopus customer? Find out how you can benefit too. T&Cs apply (only one switching offer per household)”
You can switch to E.ON Next with this code and switch to EDF (FreePhase) with this code.
Or, if you just want to say thanks, you can buy me a coffee.
You can also see more ways to support the site here via the likes of Plusnet broadband, Smarty Mobile, Havenwise remote heat pump control, Axle Energy, Quidco and more.
If you are thinking about a heat pump, check out my Trusted Heat Pump Installers page along with my guide How to Choose a Heat Pump Installer.
Follow @energystatsuk on Twitter / X, Bluesky and Mastodon for daily tariff graphs and updates.
Also, check out my Energy Unwrapped Podcast and please subscribe to my YouTube channel where podcast episodes and video articles will be published.
Note: The current and past performance of energy pricing is not necessarily a guide to the future.


